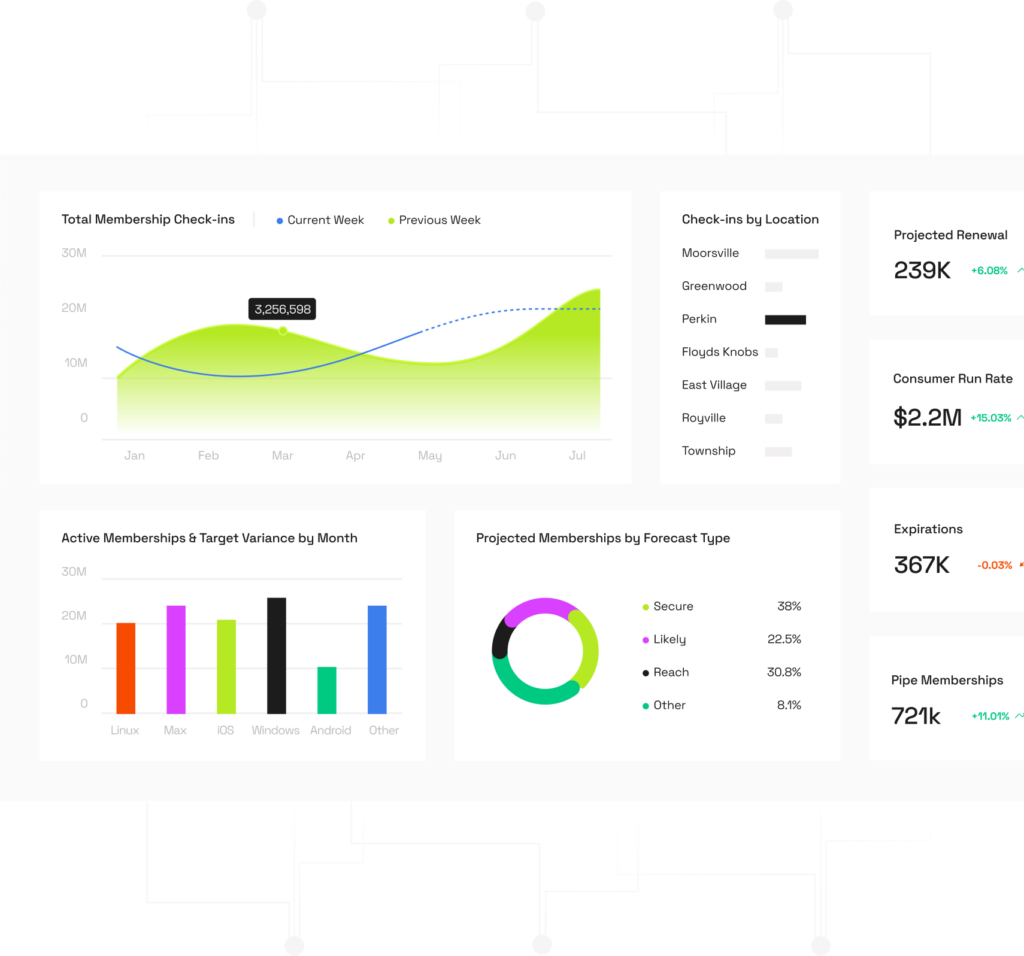
DATA VISUALIZATION DASHBOARDS
360 Degree Views of Your Operations
Bring data from all corners of your business into a single pane of glass.

BUT YOU DESERVE MORE.
Your business runs on systems. Those systems run on data.
And while those systems may communicate with each other to run your business, they’re not great at sharing data with you.
That’s why, when you need to see something as simple as your profitability, it becomes a clunky, multi-system calculation.
“Every week, we speak to another business leader who is embarrassed about the lack of visibility they have into their own business. They shouldn’t be.”
Rob Collie @ P3
Data visualization gives you total clarity. What will you do with it?
Thoughtful data visualization connects data from every system in every corner of your business, giving you answers to the most basic questions, as well as the more complicated ones.
Those beautiful dashboards are the icing on the cake. The real value of data visualization lies in minimizing the places you have to look and the questions you need to ask to learn what you really want to know.
“For that depth and clarity, you need a trusted ally. And in P3, I found unparalleled expertise and true collaboration.”
Jeff Jorgensen @ CapSix
See everything. Act on what matters most.
THE ROADMAP TO IMPROVEMENT
Specific visuals that answer specific questions
Unify complex, siloed information all in one place
See what’s happening across your business and get the answers you need to drive impact
Setup custom alerts for critical actions
Identify triggers and set dynamic thresholds that alert you to critical events
Drive organization-wide behavior with scorecards
Standardize performance criteria and see organizational change from the bottom up
Portfolio Manager & Chief Investment Officer, Cap Six
“We harness the power of AI and machine learning, to enhance business efficiency, reduce costs, and make swift, informed decisions. Yet, it’s not just about algorithms—it’s about understanding their foundation and the data behind them. For that, I found unparalleled expertise and true collaboration in P3.”
See everything. Act on what matters most.