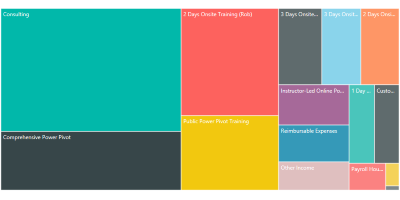

Power BI Desktop View of Our Clients by State (Map) and Breakdown by How We Help Them (TreeMap)
(Yes, this is Quickbooks Data in Power BI, and it was Painless. See Below for Examples Using Power Pivot Too)
Too Legit to Omit (the analytics, that is)
For a couple years now, we’ve been quite a bit bigger than the two-person operation of our early days. Like I mentioned in a previous post, there are now somewhere between 15 and 20 people who work for us in some capacity ranging from full-time to part-time. There are a lot of moving pieces these days – pieces that demand our attention, our comprehension.
For example, was our website redesign successful? And if so, HOW successful? How much new business did it generate? How many new clients are we helping relative to the previous “incoming” rate?
But one of those moving pieces is ME. I traveled more this year than any year previous, and that kept pushing our internal BI onto that proverbial back burner. (Being so busy is a good problem to have, but still).
As the year winds down, however, I find myself at HQ for a sustained period of time, and that’s afforded me some time to focus on this. Can you imagine how GOOD that feels? To finally find time to apply my own craft internally?
It’s thrilling, in all honesty.
Quickbooks does offer reporting, but it’s not that… Intuit. (get it?)

Some of the reports built-in to Quickbooks. Useful for accountants maybe, but not for strategic analysis.
Our financials are the logical first place to start. And our financials are in the hands of our accounting firm. Specifically, they are stored in Quickbooks.
This, of course, poses a problem. Because like ALL accounting and ERP systems, Quickbooks is primarily focused on being a great accounting system. A system that collects, stores, organizes, and routes data. Quickbooks is NOT an analytics tool.
And being an analytics (or BI or reporting, whatever you call it) tool is a full-time job. ANY system whose job it is to collect/organize/route data will NEVER be sufficient for reporting and analysis. NEVER. I’m not kidding. We should never expect different, and that’s not a “knock” on these vendors. It’s just too many missions for any one company to execute.
Furtheremore, I’ve yet to meet such a system that “wants” to give you its data. Nope, these systems, Quickbooks included, have complex internal data storage structures, and they’re not exactly keen on offering clean straws by which you can “slurp” the data, nor translators to make said data understandable and useful.

What Moses Would Say, Were He Around Today and Running a Mid-Sized Business
QQube: Translator for Power Pivot / Power BI Folks Like Us
QQube is the signature product from a company named Clearify. (Goodness gracious, Clearify is a FANTASTIC name for a company in this space. But QQube… hey, I get WHY they’d name it that, but I bet they wish they could have a do-over.)
I’ve been talking to the owner/founder of Clearify for several years now because I’ve seen the enormous potential – MILLIONS of companies use QB as their accounting system, and the Power Pivot / Power BI revolution makes industrial-strength tools affordable AND learnable for those companies for the first time ever. Chocolate, meet peanut butter. While Microsoft is indeed focused on the world’s largest companies, and for good reason, Small to Midsize Businesses (SMB’s) could be getting TREMENDOUS value out of this stuff… if they can get to their own data, that is.
Somewhere along the way, we (P3 Adaptive ) hired a real accounting firm who migrated us onto Quickbooks – Quickbooks Premier, specifically, running on our accounting firm’s servers. And like I said, I finally got time recently to try it out with our own QB data.
How it Works

Quickbooks Data is Locked Away AND Impossible to Understand in its “Raw” Storage. QQube creates a separate, clean database for us, and we connect Power Pivot / Power BI to THAT.

You Use the Config Tool to Tell QQube What You Want to “Replicate” from QB into QQube.
(In this case I’m telling it to grab just the Sales-related data, but you can multi-select LOTS of stuff).

Then You Can Start With One of their MANY Pre-built Power Pivot or Power BI Templates
(Just click Open)


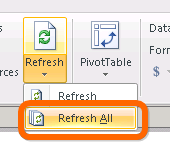
The Templates Contain Sample Quickbooks Data by Default, But Go Into Power Pivot, Click Refresh All, and Bam, It Will Now Contain YOUR Data. No additional config required.

Of Course, I Immediately Started Adding My Own Measures, Pivots, and Charts to the Template
(This is REAL DATA from our biz, not a sample)
Hey, the website DID seem to work – note the jump in October after the site went live on Oct 1, but what the HECK was going on in April/May? We don’t have sufficient history in QB yet to see whether this is a seasonal trend, but next year, we will now have the ability to perform Year Over Year comparisons… hello DATEADD function!

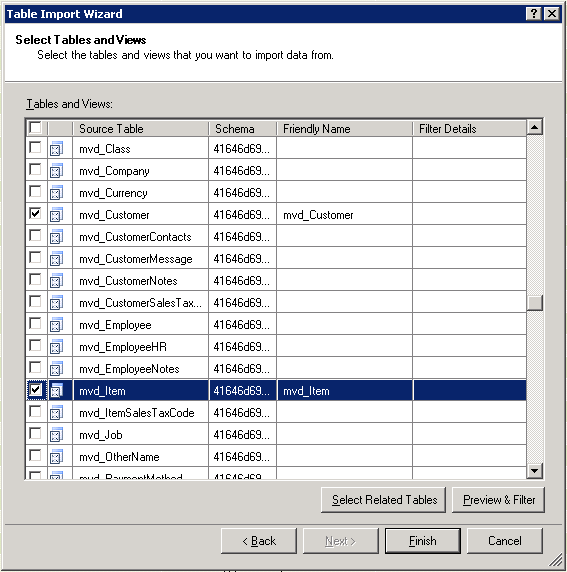
If You Want to Start 100% From Scratch, Open up Existing Connections & Pick from the Tables/Views Available
(Here I’m Grabbing the Item Table, which I used in the TreeMap view at the very top of this post)
My Observations So Far
1) This is a very, VERY serious and comprehensive product. I know that MS has a content pack for Power BI revolving around Quickbooks, but in my experience, this sort of thing (data adapters for accounting and ERP systems) is not something you can do super well unless you devote an entire company to it. And staff that company with longtime experts on the accounting or ERP system in question. (Our good friends at Simplement, for instance, fit this mold PRECISELY, but for the SAP space rather than Quickbooks. Yes, QB and SAP are products for very different “scales” of business, but the similarities in terms of the “translator” biz are striking. The folks at QQube have similarly long histories with QB).
2) The schemas and templates could be a lot better-optimized for us. Being a company that is full-time focused on building a robust translation layer is necessary to do a good job, but it’s all-consuming work. We should not expect them to ALSO be world-class Power Pivot and Power BI experts. So there’s a lot of room for them to optimize here. EX: I don’t particularly like the way they handle their date/calendar tables yet for instance, they’re not yet leveraging measures very much in their templates, and their table names are all overly-long which makes for awkward formulas.
3) That said, I AM absolutely getting tremendous value out of this already. I’ve gone from “hey I can’t get the data at all, it’s not even worth TRYING,” to quickly feeling spoiled and saying “hey, that data you gave me? I want it improved.” And they ARE listening to me, so I think we’ll also be seeing rapid improvement on this front.
4) Note that QQube is NOT new. It’s been around for years already, and lots of customers are using it. It’s just that the Power Pivot / Power BI angle is relatively new for QQube.
More Info
Anyway, I’m going to keep at it, and will update you on my progress over time. I’m stoked to finally be doing this.
In the meantime, you can check out their offerings on their website:
It’s NOT expensive, starting at $425, which is kinda crazy. I quite seriously expected it to be a couple grand, but I won’t complain.
Questions
Do you use Quickbooks? If so, are you relying on their built-in reports, or somehow building your own? If the latter, how?
Drop me a comment and let me know, I’m curious for multiple reasons, including “hey I own a business that uses Quickbooks and would love to compare notes.”
And if you have any questions for me about my experience with QQube so far, drop a comment on that, too.
Get in touch with a P3 team member