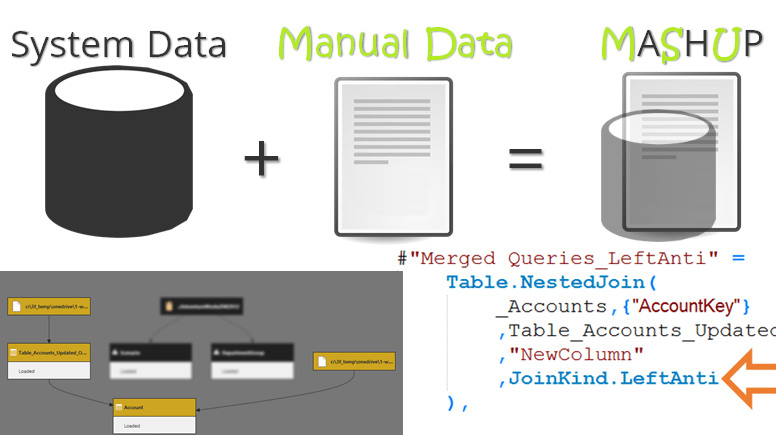
I have been working fairly extensively with Finance teams, leveraging Power BI to build financial Models, dashboards and reports. (See some of my recent posts Financial Dashboards, Personalized Dashboards and Q&A). Regardless of the team we’re working with, a very common scenario we run into, is the need to combine System data with Manual data. To clarify:-
- System Data: Represents the data coming from official system sources (could be a Data Warehouse, SAP etc.)
- Non-System/Manual Data: This may be manual data maintained by humans or this may be “System” data that is not tracked in the official system. Could be your own SQL/Access Database on the side or a system used only by your department and not the whole company.

Mashups can be fun, if done the right way
While there are many scenarios where you would need to combine System and Non-System data, for this post I want to cover one such specific scenario. Watch below or continue reading… (link to download files at the end of the post).
Scenario: What if the System Categorization does not meet your needs 100%?
Let’s say you have pulled the Data table and the Lookup tables directly from a System (official) source. However, due to some reason you are not 100% happy with the way a given Lookup table categorizes your data. For example, let’s say we are pulling expenses from the system, but need to make a few tweaks to how they are categorized in the system.
Here the changes needed are:
- “Office Supplies” needs to be categorized under “Office Expenses”
- “Professional Services” and “Other Services” need to be grouped together as “Miscellaneous”
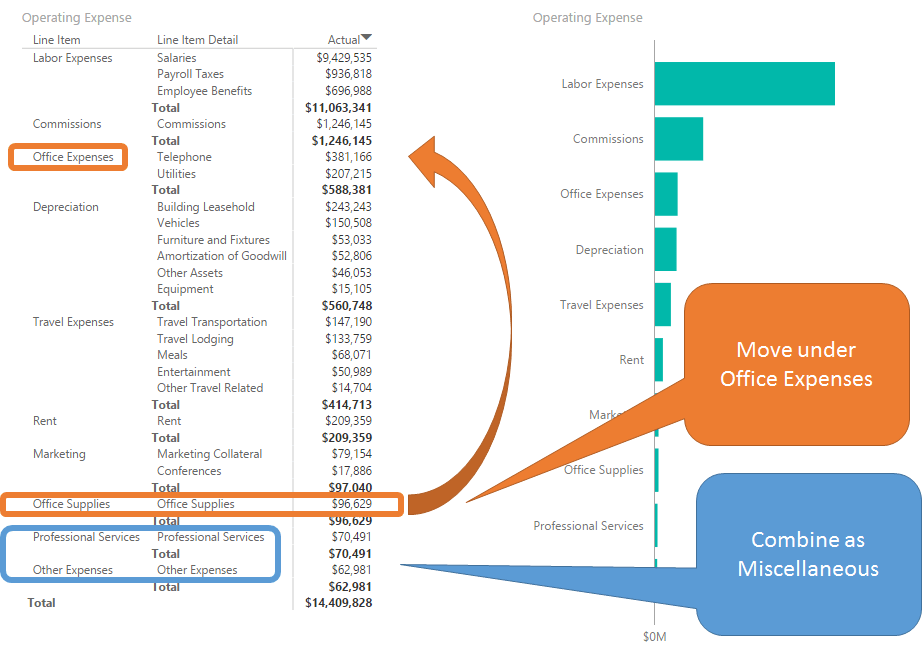
Need to override some of the system mapping
There are many scenarios where we see such a requirement
System mapping is out of date: A change has occurred in the operating system which is not yet reflected in the Reporting Systems. But of course, it needs to be reflected in the end report.
I have seen this one play out so many times. Often teams rush headlong on a project to deliver some cool new change. The impact on reporting, or the need for reporting around this change is wholly ignored. Only when the change is live, does someone raise this issue.
Of course the DGP (Data Gene Person) on the team had been screaming his/her head off about this for so long, but was ignored by everyone. And now, they turn to him/her and say. “Jim/Jane, just make it work!”. Sigh!
System is chronically behind the Business Needs: This is a slight variation of the one above. While the above can potentially be solved by adequate management; this one is perhaps unavoidable. In my experience, business always moves ahead of IT/System. Business has a bias for action, for change; business is constantly evolving. IT teams, even the best I’ve seen, have a bias for stability (read inaction). You need to prove something is needed, before the change can be implemented.
That means, there would always be a gap between where the business and business needs are versus what the IT Systems deliver. This is not a ding on IT, just a reflection on the motivations behind the two sides.
(Have a different take on this? Let us know by leaving a comment.)
Big Boss likes to see data a specific way: The higher up the totem pole we go, I realize the room for discussion gets smaller. Often when I am creating a report for a CTO/CFO, I may not even have direct access to them. In many cases, I am told that the report needs to be delivered in a specific format, with specific groupings.
Classic Approach: Hostile Takeover
The classic approach (think the Old Excel world) would involve taking over the whole mapping table. In our case, we would make a copy of the Accounts table in Excel and then edit the specific values that need to be changed. This gives you complete control over the mapping table.
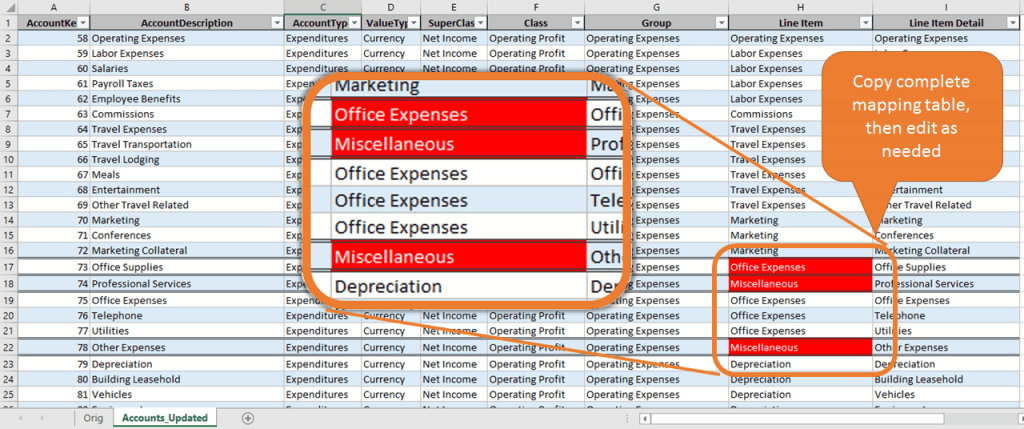
Copy the complete System Table and modify the values as needed
And this gives us the end result we desire. But if you have ever used this approach, you already know the largest pitfall. It is hard to synchronize system changes. As items get added, deleted, modified in the System table, it is really hard to sync all those changes to your Manual table
As items get added, deleted, modified in the System table, it is really hard to sync all those changes to your manual table
What we really want is a smarter approach.
Modern Approach: Precision Strike (Exception Mapping)
We really do not want complete control over the system mapping table. All we want is for the specific changes needed to be reflected, almost layered upon whatever the system mapping table is providing. Instead of copying over the complete system table, we only track the exceptions in our manual table. Then we would smartly combine these manual exceptions with the system data using Power Query. Only tracking exceptions in the manual table makes for a much more compact manual table and also ensures that all the system changes (additions, modifications, deletions) would flow through to our model unmolested – without us having to manage them manually.
Only track exceptions in the manual table
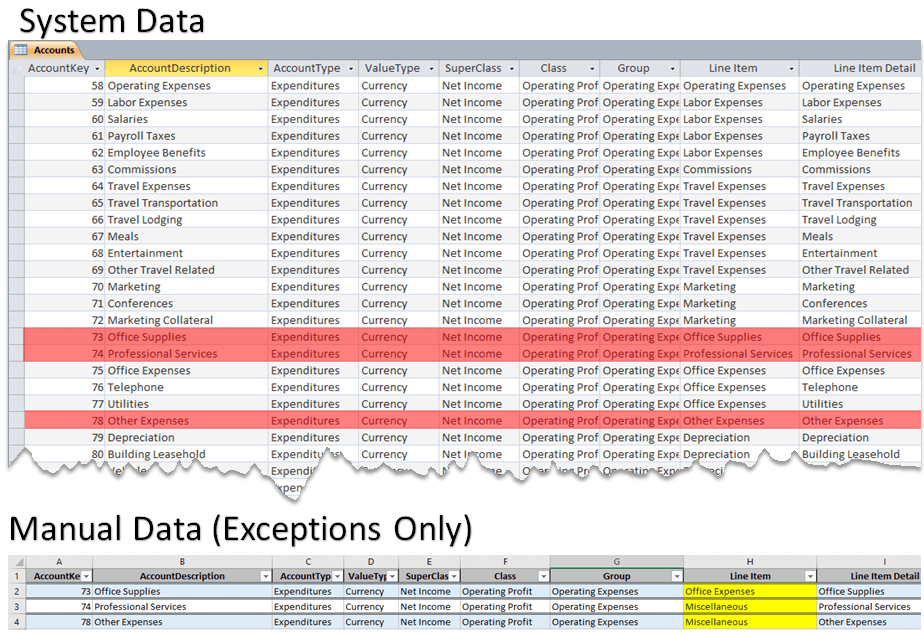
Only track the exceptions in our manual table
Here is a graphical view (Query Dependencies view) from Power Query.

Overlay the Manual data on top of System Data
Here is the Power Query code.
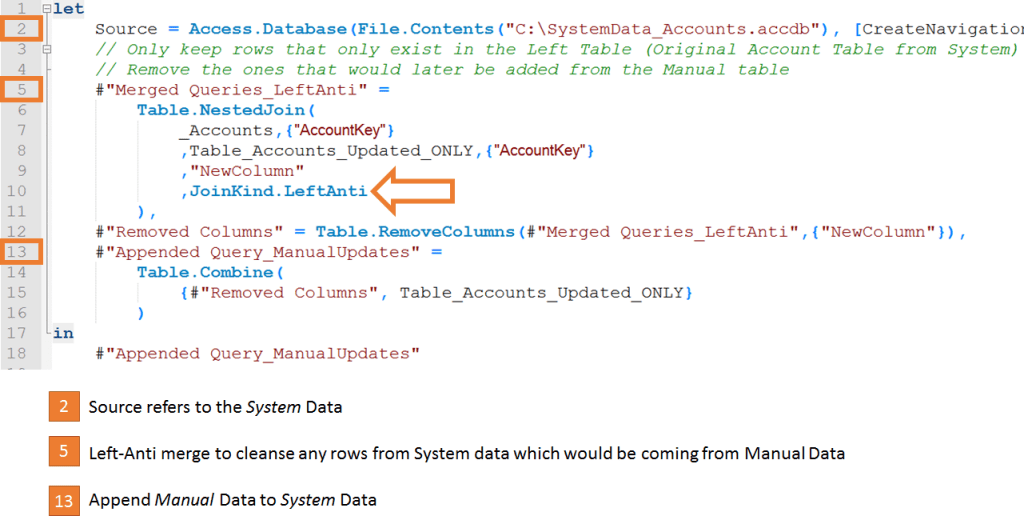
Power Query to splice in System and Manual data (click to enlarge)
I have found this Left-Anti Merge approach to be more deterministic. As opposed to Appending Manual data and then removing duplicates or some other approach. Surely there would be other ways to do this, but this works for me.
And here is the desired end result in the report:
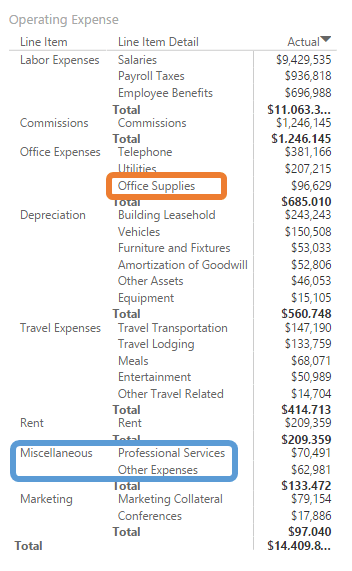
Our manual exception mapping have been overlaid on the system mapping
Combining System and Manual Data: a Universal Problem?
As I mentioned in the opening, I have encountered the need of combining system and manual data in nearly every Power BI* project I have been associated with. And M (Power Query) & DAX (Power Pivot) engines have enabled me build robust and elegant solutions to effortlessly combine system and manual data.
(* I use Power BI in the generic sense, encompassing both Power BI and Excel/Power Pivot/Power Query world.)
Tell us what your experiences have been combining
- system and manual data
- system and external data
- or generally data from multiple sources
Do you have any of your favorite tricks that have helped you?
Download Files: ZIP
Get in touch with a P3 team member