
My name is Mathew Herring Jack, and I am a member of Traditional Excel Users Anonymous.
As a Traditional Excel User, I could not stop copying and pasting downloaded reports. Even when my manager diagnosed me with inaccurate month-end reporting, I could not stop using external workbook links. I admitted my reckless use of nested IF statements was hurting others, yet I knew I would do it again. I still don’t know why I needed to type FALSE at the end of my VLOOKUP’s – it makes no sense.

Yet, here I am today, using Excel as much as almost anyone on the planet, now many years SUMPRODUCT free. I almost never use the CTRL key anymore. In fact, I use the mouse a LOT in Excel now. A Traditional Excel User could never admit such a thing.
How is it possible to still be here today saying that I am an Excel expert and yet I don’t even use the formula bar anymore!
I found a way out. By following the 28-step program as described in the Big Book of Traditional Excel Users Anonymous and living in the disciplines of DAX and M every day, I can remain abstinent from Traditional Excel and the allure of absolute referencing.
I now know how to live without Traditional Excel. The compulsion to show off even my array formulas has been removed. My progressive illness has been arrested. My disease has been put into remission. I now dedicate my life to traveling the country helping others recover from the affliction… See you in Boston!
And Back To Your Regular Scheduled “Programming”
Today we’re revisiting my gateway drug, and we’re going to use the Power BI web connector to import every Excel Function to go alongside the DAX reference we built in part 1 of The Great Function Project.
If you missed part 1, go back and follow the steps. It should take all of about 5 minutes to get caught up. Part 2 should only take 5-10 minutes on top of that.
The general idea is that we’re together co-developing a Power BI reference that contains information on every DAX, Excel and M function available. We’ll analyze the similarities and differences between the three languages and will leave you with a useful resource to help you and your organization transition from Traditional Excel to Modern Excel.
If you did follow along with Part 1, re-open your workbook and insert coin to continue.
Web Scraping? Sounds Painful
Not everyone wants their online content harvested, but if you want to enrich your data model, there is a vast data source that you might be ignoring – the web. Need performance reporting adjusted from the population? Can do. Want to quantify the impact of a Patriots win on your Sunday sales? There’s a source for that.
Need every Excel function available? Check this link out.
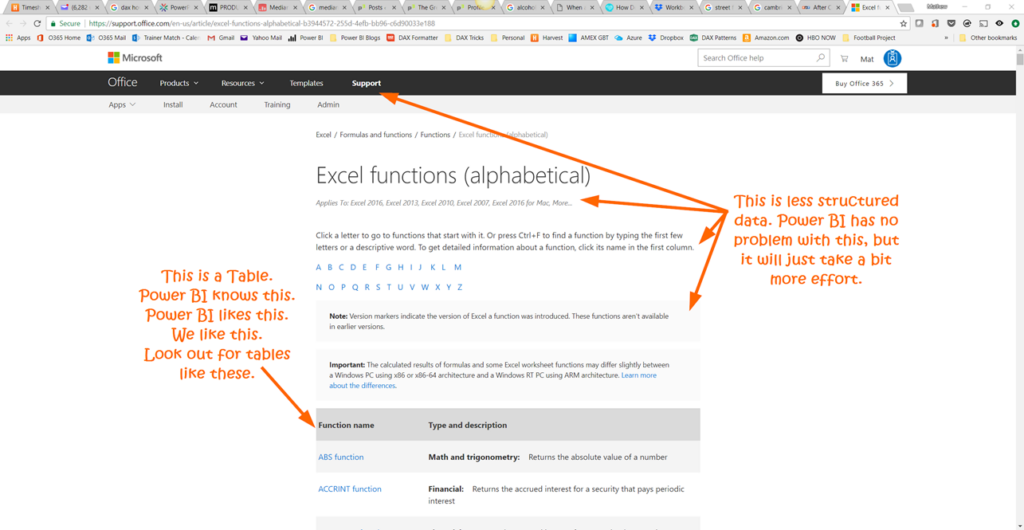
Scroll down the page and look at all 471 of those Excel functions! Your scrolling finger is getting sore? OK then, I have a better idea. Let’s use this page as a data source and save it in Power BI for later.
Go to Get Data –> Web
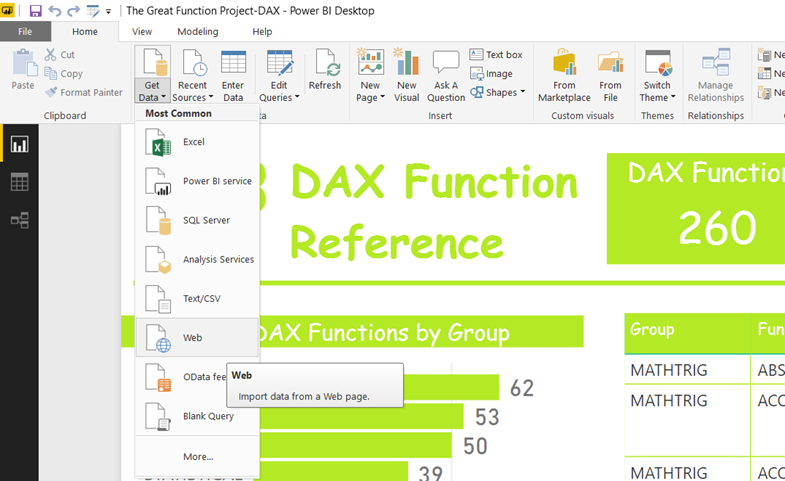
Paste this url into the next screen and hit OK.

Power BI looked at that webpage and what it found were two important elements – Document and Table 0. Table 0 looks to have all the good information in it, so check the box next to it and hit ‘Edit.’
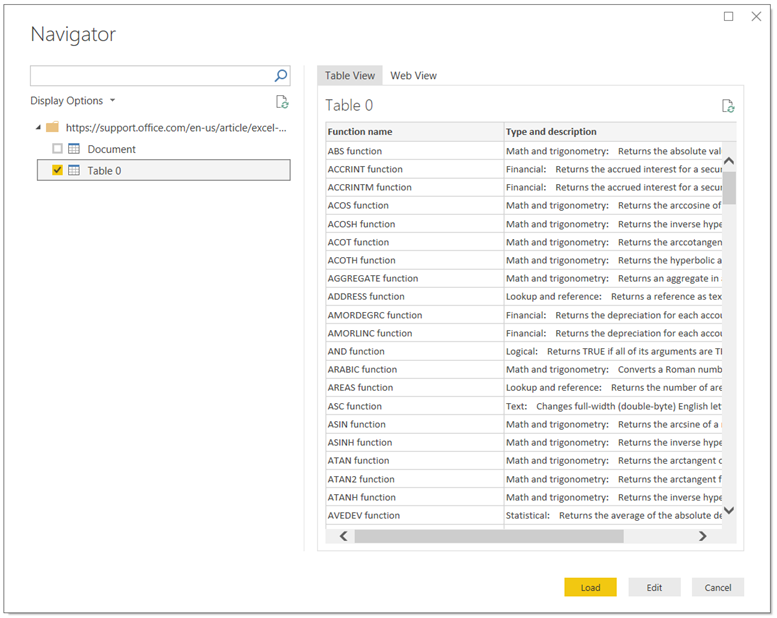
Commence Right Clicking
Rename your new Query to Excel and let’s do a little data cleanup… The goal here is to have three columns – Function Name, Function Group and Function Description AND to have Function Name is a similar enough format to the DAX Query that later on we’ll be able to link them together by a relationship.
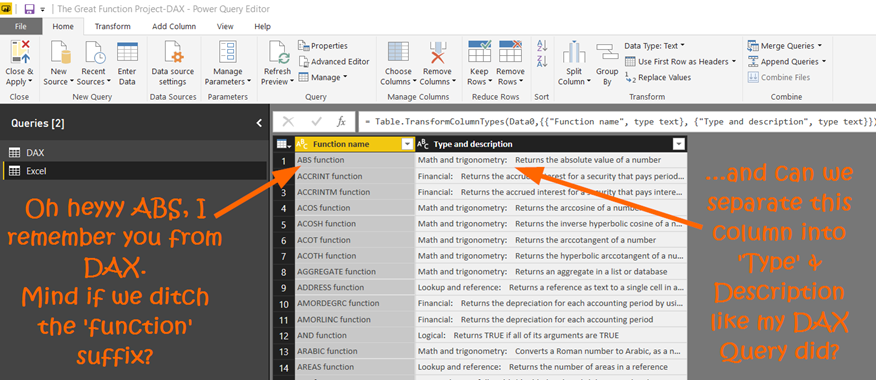
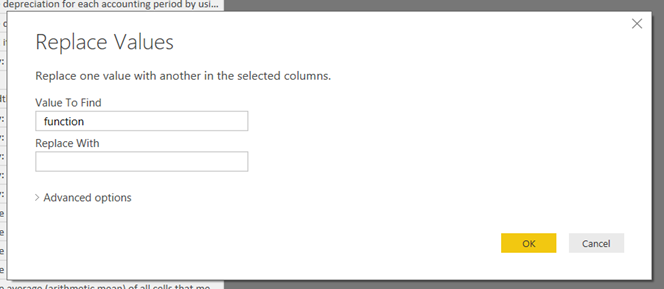
1) Right click on Function Name column and select ‘Replace Values.’ Enter “ function” in as the Value To Find – note the space preceding the word ‘function.’ Hit OK.
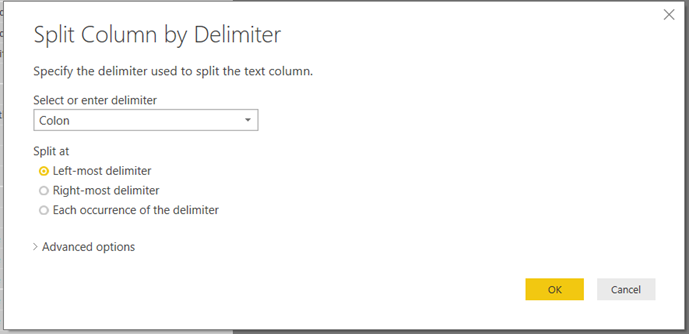
2) Right-click on the ‘Type and description’ column and select Split Column –> By Delimiter. Select ‘Colon’ as the delimiter and check the ‘Left-most delimiter’ button. Hit OK.

Looking better, but happiness has not been achieved. More right-clicking is necessary.
3) Right-click column ‘Type and description.1’ and select Rename Columns. Rename to ‘Function Group.’ Right-click column ‘Type and description.2’ and select Rename Columns. Rename to ‘Excel Function Description.’
4) Right-click the ‘Excel Function Description’ column and select Transform –> Trim. This will get rid of spaces at the beginning or end of the column.
Excel – The Gateway Drug
I was a Finance guy. You wanted a business model? I could do that. Need a merger model to bolt onto that? I could do that too. Need a GAAP-compliant quarterly financial statement consolidations package that integrated with Word? Give me a few days. Traditional Excel put beer in my fridge for 15 years.
I’m not someone who’ll necessarily step outside my comfort zone. If I’m pushed outside of it, then I’ll run with it and thank you later. But in 2012, nobody was going to push me out of my Excel comfort zone. DAX was around, but let’s just say that its existence wasn’t well known, let alone how to find it.
So lucky for me, there was a lot of overlap between DAX and Excel – I didn’t need to step out of my comfort zone.
How much overlap EXACTLY though? Well, let’s find out… we’ll need to create a lookup table between our DAX and Excel tables.
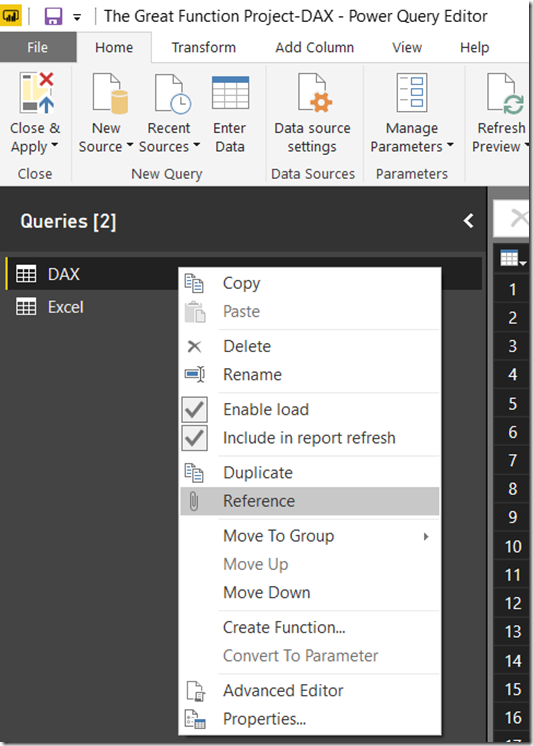
Right-click on the DAX query from Part 1 and select ’Reference.’ Then rename that new query to ‘Function Lookup Table.’
Before we do the next step, go back and make sure that you have a column named ‘Function Name’ in both your DAX Query and your Excel Query. As a reminder, Power Query is case sensitive, so it needs to be exactly the same in both. My queries looked like this:
DAX Query
![2018-03-25 23_01_50-The Great Function Project-Excel - Power Query Editor_thumb[1] DAX Query](https://p3adaptive.com/wp-content/uploads/2024/05/2018-03-25-23_01_50-The-Great-Function-Project-Excel-Power-Query-Editor_thumb1_thumb-1024x122.png)
Excel Query
![2018-03-25 23_02_15-The Great Function Project-Excel - Power Query Editor_thumb[2] Excel Query](https://p3adaptive.com/wp-content/uploads/2024/05/2018-03-25-23_02_15-The-Great-Function-Project-Excel-Power-Query-Editor_thumb2_thumb.png)
Now left click on Append Queries in the top right. Then select Excel from the drop-down menu Table to Append. If you get a message about Privacy settings just check ‘Ignore’ and move on.
![2018-03-24 17_01_44-The Great Function Project-DAX - Power Query Editor_thumb[1]_thumb Click here](https://p3adaptive.com/wp-content/uploads/2024/05/2018-03-24-17_01_44-The-Great-Function-Project-DAX-Power-Query-Editor_thumb1_thumb_thumb-1024x335.png)
You should now have a table that looks something like this:
![2018-03-24 17_08_55-DVprectable.txt.xlsx - Excel_thumb[1]_thumb looks like this](https://p3adaptive.com/wp-content/uploads/2024/05/2018-03-24-17_08_55-DVprectable.txt.xlsx-Excel_thumb1_thumb_thumb-1024x194.png)
This is more information than we need for the basic lookup table we are aiming for here.
Right Click on the Function Name column and select ‘Remove Other Columns,’ ’then right click again and select Remove Duplicates and now you have the most vanilla lookup table possible.
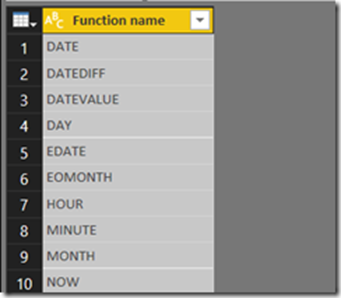
Hit ‘Close and Apply’ and Power BI will likely create the relationships for you, but if not just replicate this structure, creating the relationship using the Function Name columns..
![2018-03-25 23_26_08-The Great Function Project-Excel - Power BI Desktop_thumb[3] function lookup table](https://p3adaptive.com/wp-content/uploads/2024/05/2018-03-25-23_26_08-The-Great-Function-Project-Excel-Power-BI-Desktop_thumb3_thumb.png)
Finally, time to write some DAX.
# of DAX Functions =
COUNTROWS ( ‘DAX’ )
# of Excel Functions =
COUNTROWS ( Excel )
# of Functions in Both DAX & Excel =
CALCULATE (
COUNTROWS ( ‘Function Lookup Table’ ),
FILTER (
‘Function Lookup Table’,
[# of Excel Functions] = 1
&& [# of DAX Functions] = 1
)
)
% of DAX already in Excel =
DIVIDE ( [# of Functions in Both DAX & Excel], [# of DAX Functions])
And there we have our answer, 48.09% of the DAX language was already present in Excel.
Now, this doesn’t tell the whole story at all, but regardless of the numbers, getting started with DAX is within the comfort zone of anyone that’s written a SUM in Excel and lived to tell the tale.
Excel isn’t going anywhere as the world’s most used BI tool – but in the years to come in might just be used a little less…. traditionally.
As for Power BI, in my opinion, this extensibility is what drives it “from nowhere to being the leader in BI in the cloud” with “a $500 million annualized billings run rate for its 2018 fiscal year”. Achieving these milestones is a lot easier when 1 billion people already know 48.09% of your new product’s language.
Next up in the series is M…. I’ll be posting that on Tuesday 17th April. The lack of intellisense in M is was the primary reason I started the Great Function Project, so it’s kind of the Grand Finale.
Did you find this article easier to understand than the average “tech” article?
We like to think that is no accident. We’re different. First of a new breed – the kind who can speak tech, biz, and human all at the same time.
Want this kind of readily-absorbable, human-oriented Power BI instruction for your team? Hire us for a private training at your facility, OR attend one of our public workshops!
Get in touch with a P3 team member