It’s sometimes difficult to find things that Power BI can’t do. There always seems to be a solution no matter the task at hand. A little while ago I was wondering to myself if it was possible to embed a website inside of a Power BI report. My initial instinct was “Of course! But how?” It turns out that this is very easy to do with a little bit of HTML code inside of a calculated column! Without further ado, let’s jump into it.
Here’s a quick look at a data set that I compiled. It is made up of three of my favorite Power BI blogs including P3 Adaptive , Excelerator BI, and SQLBI. I grabbed a blog post URL from each of these websites and threw it into Power BI. I also included a fake number of “Pageviews” to add some numerical data into the mix.

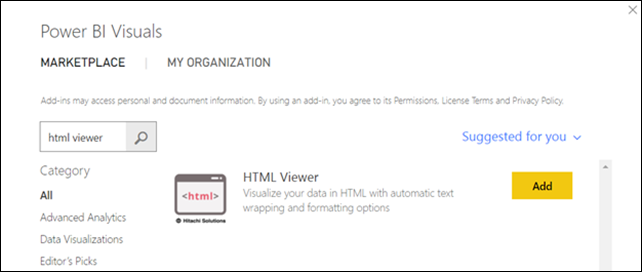
To make the magic happen, we need to employ the help of the HTML Viewer custom visual available on the Custom Visual Marketplace. To load it into the report, simply click the ellipses in the visuals pane and select “Import from marketplace.” Search for the HTML viewer and press “Add.”

This visual takes HTML code and transforms it into a visual format, indicative of what you would see on a website. We can leverage this functionality and embed websites using the HTML “iframe” element. Firstly, an element specifies what should show up on the page and is usually indicated by a starting and closing tag. For example, if you wanted to specify how the body of a web page should look, you would type:
<body>Interesting Post Here</body>
As you can see, the <body> tag declares the start of the body section while the </body> signifies the end. For embedding a website, we are going to use the <iframe> and </iframe> tags, designed specifically for showing an HTML document inside of another HTML document.
We want to create a calculated column that will put our URLs into the proper HTML format starting and ending with iframe tags. The desired output will look as follows:
<iframe src=’https://example.com’></iframe>
A couple of things to note about the syntax… “src” stands for source and is the URL that we would like to show. Also, our URL needs to be surrounded by quotation marks, either single or double. Since we’ll be writing this with DAX where text strings are specified with double quotes, we’ll use single quotes in our HTML. The DAX code to get this working is:
HTML = “<iframe src=” & ‘table’[URL] & “></iframe>”
The results of the calculated column should look like:

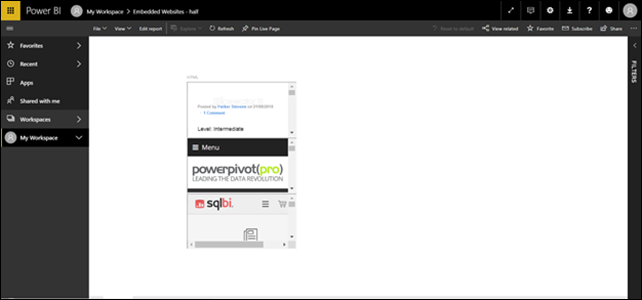
With that calculated column now created, bring in the HTML Viewer custom visual into the report and throw in your new calculated column the “Category” well. You shouldn’t see anything populated in the visual other than some grey boxes. This is good! Our websites won’t display properly until we publish this up to Power BI Service. Go ahead and publish your report and open it up. You should now see the websites you specified via URL! You can even click around inside of the embedded website and navigate as if you were on the actual page! Pretty cool, huh?

A couple of housekeeping items… let’s resize the iframe so that it takes up the entire visual. You can do this by specifying a few arguments in the iframe tag with the “style” keyword. The final calculated column definition will look like:
Iframe = “<iframe src=” & ‘table’[URL] & “ style=’position:fixed; width: 100%; height: 100%’></iframe>”

To style properly, we need to set the position to fixed and specify that the height and width take up 100% of the visual. With this in place, everything should be working as expected. You can even throw in some slicers or other visuals that, upon selection, will dynamically change which web page is shown.
And we’re done!
P3 Adaptive inside of a Power BI report 😮
A final note: Not all web pages can be rendered in an iframe. Some websites such as Google and Amazon do not allow their content to be hosted on another site via iframes. Keep this in mind when using this trick! I hope you enjoyed this post and can find some use cases for embedding a web page inside of your Power BI report!
Did you find this article easier to understand than the average “tech” article?
We like to think that is no accident. We’re different. First of a new breed – the kind who can speak tech, biz, and human all at the same time.
Want this kind of readily-absorbable, human-oriented Power BI instruction for your team? Hire us for a private training at your facility, OR attend one of our public workshops!
Get in touch with a P3 team member