“I’ve always believed that the mind was the most dangerous weapon.”
-John Rambo

…which explains the huge muscles and machine gun, right John?
A View of BI that Henry Ford would have Loved
In part one I described how I grew a bit disheartened by BI back in 2005 – a lot of good thinking was going on, but it wasn’t the kind of thinking that got me jazzed about going to work.
Back when the term was fresh, the word “Intelligence” was so much more energizing than what I ultimately saw in practice. Where, exactly, was this “intelligence” I’d been promised?
Instead, I saw data being squeezed into fixed molds, tightly secured, modeled by IT (and by committee) and then ultimately delivered to knowledge workers via a handful of tightly managed, supercharged data browsers.
Again, don’t get me wrong. I understood the necessity of those kinds of stacks. I understood why the Wild West chaos that grew in the absence of such stacks needed to be reined in. And I had also personally worked for two teams at MS (I won’t name them) who collected usage metric data by the ton, and yet had no respectable way to explore it (both have since been addressed, but boy was it infuriating at the time). That all made sense to me.
Bring back the human intellect!
But I had been hoping for better. In a nutshell, it seemed like centralized BI efforts were spreading the following philosophy: “Leaving things to human ingenuity has led to chaos, so clearly, the answer is to marginalize the role of the human beings as much as possible.”
Why does it have to be so extreme? It doesn’t. We all just needed to break out of our little boxes and see that there were other things possible. PowerPivot is a HUGE step toward getting the human brain back into the loop. Even in the short existence of this blog, I’ve shown a number of places where a human brain, operating close to a business problem, can do amazing stuff when it is cut loose. A few examples, for refresher’s sake…
Breaking out sales data by temperature at the point of sale (using Intenet data):

Joining disparate data sets that IT would never warehouse:

The Bing test team slicing/grouping their data in ways they had not even imagined the day before they tried PowerPivot:

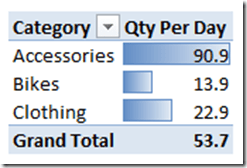
Using conditional formatting and DAX measures to make previously unseen comparisons jump right off the page:

Creating custom calculated groupings in less than a minute using something as simple as the IF() function and a calc column:

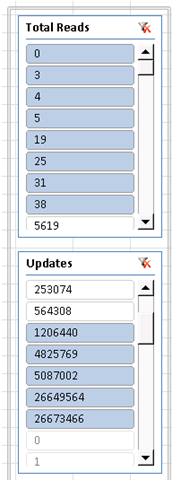
And then today, a friend of mine quickly discovering that he has indices in his SQL server that were not helping, just sucking resources. (As a bonus, he learned this from the slicers themselves, he really didn’t even need a table or chart!)

Self-Service BI = QUALITATIVE Advances, not just Quantitative
Even for a longtime member of the team, this was a relatively recent revelation. (Alliteration for the win!).
When we started PowerPivot, “Self Service BI” was the mantra. It still is, to a large degree. And for us, that generally meant “look at all these business needs that go unmet because of insufficient capacity! We can fix that!” So even though we never said it this way, increased Quantity of reporting/analysis was the driving force.
But more generally, we were knocking down a wall. Yes, that wall was holding back a large quantity of data analysis and reporting. But you never really know what’s behind a wall, until you knock it down. Cut people loose, and not only do unmet requests suddenly become met, but previously unformulated questions get asked, and quickly answered.
That’s worth restating, so I will 🙂

(As an interesting parallel, the same thing happened with us switching to an in-memory store for PowerPivot. Take off the multi-decade straitjacket enforced by a physical rotating disk with a mechanical seeker head, and what happens? A series of successive Eureka! moments – “Oh, YEAH, we can do THAT, TOO! WOW!” – and by the time we were done, we had an engine whose feature set and characteristics far exceeded the original vision.)
So… a greater quantity of questions get answered. Questions get answered more quickly. And perhaps most significantly, better questions get formulated and answered.
Sounds like Agility. And dare I say it, Intelligence.
I’m glad to be back in BI.
Coming in Pt Three: Blending the Strengths vs. Turning Back the Clock
When I started to write about this particular topic, I thought it was just going to be a single post. It turned out to be more 🙂
So to keep things from running too lengthy, I’m gonna stop here and pick it up next week, when I will cover how this empowerment does NOT mean a reversion to the Wild West of Data.
Get in touch with a P3 team member