-Guest Post by the one and only Dany Hoter!
We Excel geeks aren’t spoiled with fancy query builders. We have had MSQuery for the last what? 15 years?
Suffice to say it is a tool from the class of Access 1.0.
For those of you not familiar with it’s looks here it is:
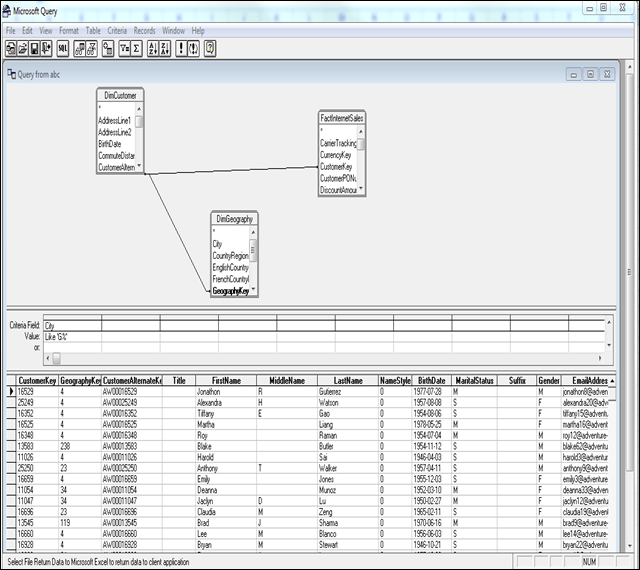
Not only it looks very old but on the technical side it only supports SQL features which existed somewhere in the late 80’s or early 90’s.
Enters PowerPivot
If you followed the posts on this blog and others about PowerPivot you heard a lot about DAX calculations and creating relationships between tables and about using the tables in PP to create nice looking presentations.
What you haven’t heard so much about are the query designers. Maybe it is because this feature doesn’t look so special for someone coming for the world of SQL Server Reporting Services (SSRS) and SQL Server Integration Services or just plain Visual Studio development. For us the lowly Excel users the possibility to use a decent query designer for creating complex SQL queries in a drag and drop fashion is a very significant improvement.
Not only we received a query designer but we actually have 2 , one for SQL Server and one for Analysis Services. (Notice the specific mentioning of SQL Server and not just any relational database, not even Access (Sigh…)
Using the SQL server Query designer
So you want to bring data from some tables in SQL Server. You connect and choose the option to write a query that will specify the data to import and not the option to select tables. This is what you see:
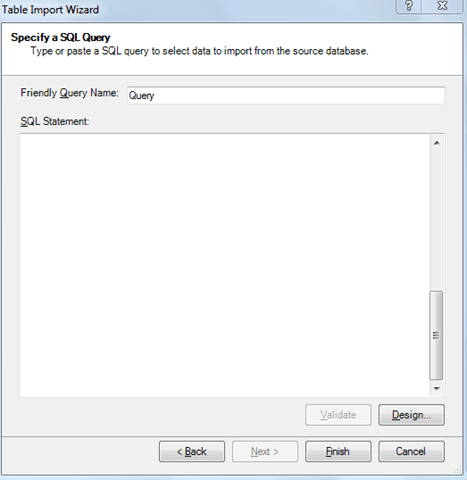
Is it the time to remember your (extinct (?)) SQL skills or maybe paste a SQL statement you generated in SQL enterprise management?
This is what I thought too and I actually did paste SQL syntax generated by a foreign tool (Business objects but please do not tell anyone about it).
Only later I noticed the button on the bottom right saying “Design” and gave it a try with very low expectations.
The main protagonist appears:
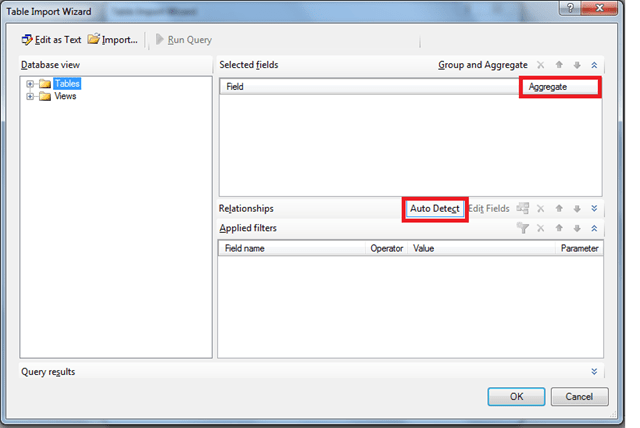
(The red frames are added by the special effects department)
Table Relationships (AKA joins)
After selecting a few tables we get this:
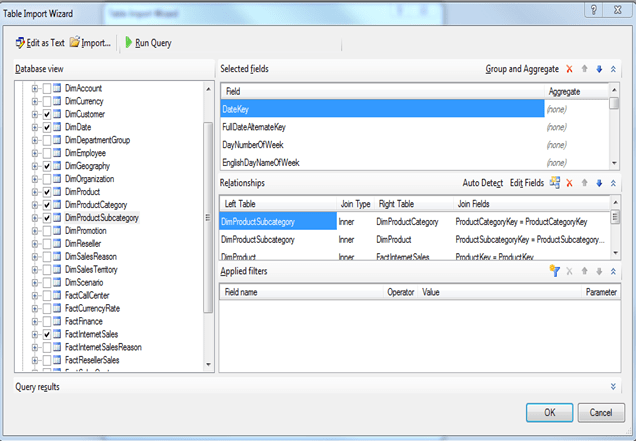
The relationships were discovered automatically by the designer based on constraints in the database.
If the auto detected relationships are not enough or needed to be changed you can unselect the auto detect option and click Edit fields or on the icon for add relationships. For the example in the case of the Adventure works database there are three date fields in the Fact table related to the DimDate table. The auto detected relationships for the DimDate table look like this:
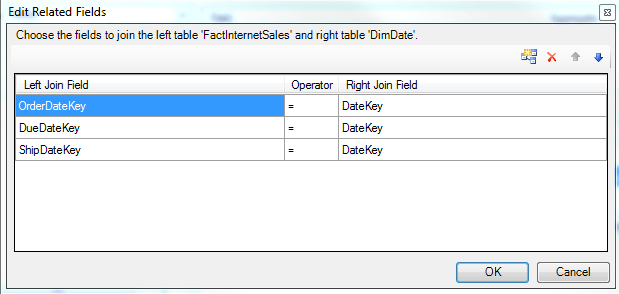
This settings will result in 0 rows retrieved because it requires that all three dates will be the same which is very unlikely. You can delete 2 out of 3 relations and chose the Date dimension that is best. You can also edit the SQL syntax and join the DimDate a second time. I couldn’t find a way to do that in the graphical designer. Notice that once you edit the graphically designed query, you can’t go back because the wizard will discard your query and you’ll have to start over.
Filters
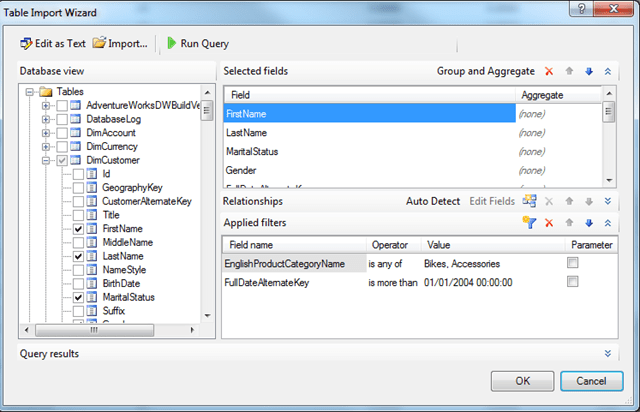
Notice that the option for parameters is not implemented in this release.
A nice touch is the option for creating multiple choices by clicking on the + sign in the edit control. Unfortunately there is no list of values and you have to know the value you want to filter on.
At any point you can run the query and see the results.
Aggregate query
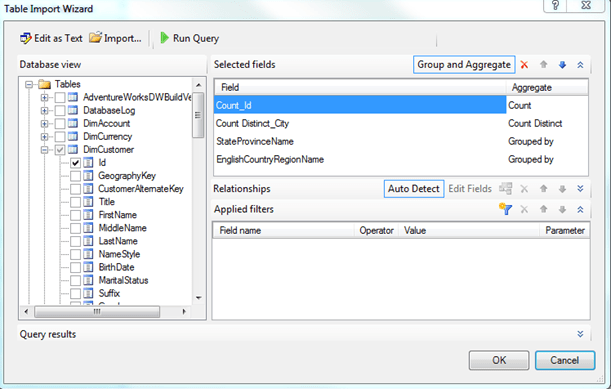
You can generate aggregate queries by clicking the Group and Aggregate button and changing selecting some fields for the aggregation. Any other field in the query will automatically be part of the group by.
Entering the designer again
From the PowerPivot menu you can use table properties to enter the designer again.
Using the analysis services designer
Before we see the AS or MDX query designer we should ask ourselves why do we need to bring data from a cube into PowerPivot.
Aren’t we making a multidimensional object into a flat table just to make it again a multi dimensional object ?
At this point I’ll give just two reasons why this exercise can be useful.
- Bringing data from two or more separate cube on potentially more than one server.
- Combining data in a cube from data not (yet?) in the cube from a SQL table or from a table in Excel. The last option I found very powerful and have used it in production already(A good topic for another post)
Using the designer
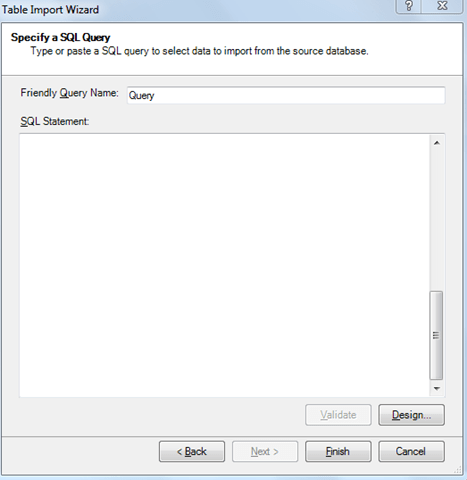
Looks familiar ah? Same principle here, first try to your MDX skills and only then after some frustration notice the design button and give it a try. I’ll risk being obnoxious here:
PowerPivot team – first use the graphic designer and only from there allow text editing
I hope the message is clear enough 🙂
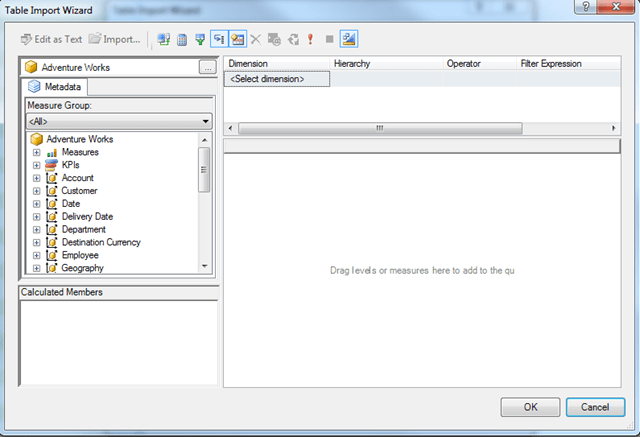
From here you are basically in Drag&Drop heaven. You can drag measures, fields , whole hierarchies , a whole dimension etc.
Filtering experience is very friendly indeed:

You have lists of values and hierarchy navigation while choosing values.
You can even create new calculated values but I’m afraid that one can get lost with all the different options of creating calculations in the server cube, as part of the query , in the table once in PowerPivot , in the pivot table 🙂
One important word of caution about calculations. The calculated members from the cube will be transformed to regular fields with fixed values once brought into the PP environment. Any dynamic nature they have will be lost.
Another word of caution is about security.
Unless you publish the PowerPivot with data open for everyone and force the user to refresh the query using her own credentials, you risk breaching cube security. If you query using the credentials of a user who can see all the cube and give other users the right to open the Excel workbook, they are going to see all data until they attempt to refresh. This is not different from sharing a static report or a regular Excel pivot that does not refresh on open.
Summary
These two designers are a reason enough to start using PowerPivot , don’t you agree?
Get in touch with a P3 team member