
The battle between Tableau and Power BI is always a hot topic. These two giants dominate the landscape, each boasting their own strengths. But which one is best for your business needs? Is Tableau a true Power BI alternative?
As a Power BI Consulting expert, we bring you the most relevant and latest information to help you decide. From the market share, ease of use, cost, and more, we’ve got you covered. Grab your coffee, and let’s dive in!
What Is the Major Difference Between Power BI and Tableau?
On the surface, when comparing Power BI vs Tableau, they appear very similar. Both are business intelligence tools. Both create slick dashboards and offer more than one data visualization tool. In fact, most people can’t distinguish between a dashboard created in Tableau and one created in Power BI.
Each of them has its strengths. However, their core difference lies in their approach to data integration, transformation, and analysis. Now, let’s break this down.
Data Integration
Power BI is designed with an understanding of diverse business environments, where information often comes from multiple data sources and different systems. It provides a seamless way to connect these systems, extract the data, and transform it for analysis and data visualizations.
For Tableau, this tool assumes that your data comes from one source. You will need to do extra work to combine data from multiple sources into one, which can be complex and time-consuming.
Ownership is another important factor to consider.
Microsoft owns Power BI, while Tableau is a Salesforce product. This can influence integration with other platforms.
Microsoft is a general platform vendor with a broad range of offerings in nearly every category, and is not dependent on any single product for its revenues. This means that Power BI is tightly integrated with offerings that most companies already use (such as Office, Windows, SharePoint, and Azure). Microsoft’s positioning as a general platform play makes Power BI incredibly open to integration with ALL software platforms. Salesforce, by contrast, grew out of its core CRM product which still drives most of its revenue, and lacks the long history of being a general platform vendor. Close integration between Tableau and other Salesforce products is therefore quite a bit less valuable than Power BI integration with other Microsoft products, but Salesforce’s lack of history as a general platform vendor makes broad interoperability less of a priority in general.
Data Transformation
Microsoft Power BI has Power Query to handle the ETL (Extract, Transform, and Load) process. This best-in-class ETL tool makes it easier to clean up and shape your data quickly, even if it comes from multiple sources.
On the other hand, Tableau does not provide robust tools for the ETL process. You can connect to various data sources and perform basic data transformation tasks. However, when you need to address more complex ETL tasks, Tableau’s Power Query competitor (Tableau Prep) is neither as robust nor as complete as Power Query. This is again relatively unsurprising given Microsoft’s long history as a platform and tools company. In fact, Power Query was originally invented in Microsoft’s developer tools and languages division – a product category in which Salesforce has never participated.
Data Analysis
Power BI has a data model concept that enables multi-system linkage. Once you’ve built your data model, you can use it to answer many questions as well as build other dashboards.
But with Tableau, it’s different. If you’ve already created a dashboard and want to make a new one that’s similar, you might have to redo a lot of the same steps—like the steps to join data from different sources. This can make the process of creating multiple dashboards in Tableau time-consuming and repetitive.
Overall, Power BI seems better equipped to handle the challenges. Despite being less expensive, Power BI is considered more effective in practice.
How Much Does Tableau and Power BI Cost?
Now, let’s look at Tableau vs. Power BI cost.
Here is a simple comparison from their pricing page that shows how much it costs for individuals. As you can see, Tableau is pricier. And this might explain why many of their customers are looking for alternatives.
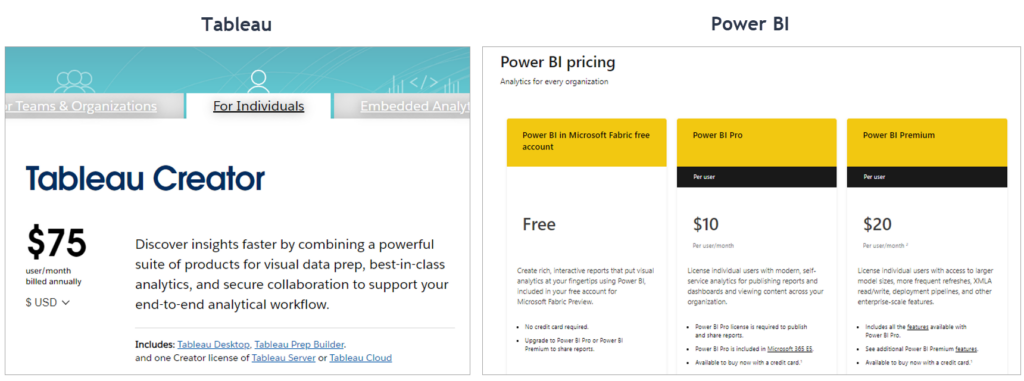
Tableau Pricing
Tableau has different pricing tiers for individuals and organizations.
For individuals, Tableau Creator costs $75 per user per month. The license includes Tableau Desktop, Tableau Prep Builder, and one Creator license of Tableau Server or Tableau Cloud.
The price varies for organizations based on the number of users and deployment options (on-premise or fully hosted).
Power BI Pricing
Power BI provides a free version through the Microsoft Fabric free account.
The paid version has Pro and Premium licenses, priced at a reasonable $10 and $20 per user per month. If you have a Microsoft 365 E5 subscription, Power BI Pro is included at no extra cost.
Which BI Tool Has the Highest Market Share?
As of writing, Power BI has the highest market share among Business Intelligence (BI) tools.
Despite being a relative newcomer, Power BI has shown rapid growth and managed to outpace Tableau as of early 2021. The Tableau vs Power BI market share stats from that year show Power BI holds a market share of 36%, while Tableau holds only 20%. This is impressive, considering Power BI launched 12 years after Tableau.
Power BI is expanding its market share quickly. The main reason for this is that it looks much like Tableau but is more affordable.
Which Is Easy, Power BI or Tableau?
One of the first considerations when choosing any tool is the ease of use. After all, you want a tool that is intuitive and user-friendly so you can get started quickly.
The good news is both Tableau and Power BI are easy to get started with. They have a user-friendly interface that lets you create reports and dashboards easily. You can also drag and drop different elements to make the visualization you want.
Tableau deserves a lot of credit for its usability at the visual layer. Certain chart effects are easier to achieve in Tableau than Power BI, for example.
But most businesses find themselves quickly falling off the end of Tableau’s “easy to use” features, with no good solution possible. Power BI, by contrast, is almost infinitely flexible and can nearly always address your needs, even if it requires a little bit of expertise. In short, Tableau is “easy but limited,” and Power BI is far more flexible and unconstrained, but that flexibility DOES make certain tasks a bit harder in the beginning. In most business situations, that flexibility is absolutely essential.
Is Power BI or Tableau More Useful?
Overall, Power BI is quite a bit more useful than Tableau. Its flexibility allows it to meet a much more complete set of business needs, and overall it’s just built for the noisy and chaotic conditions of the real world.
In narrow situations however where the data is clean and stabilized, business requirements are straightforward, and the needs of the business remain relatively static over time, Tableau remains a perfectly adequate choice and the differences between the tools become less apparent.
Do More People Use Tableau or Power BI?
It’s true that both of these platforms are widely used.
However, Power BI has a larger user base. A key reason is its seamless integration with other Microsoft products that many businesses already have in their arsenal. Also, Power BI is generally more budget-friendly, making it an attractive choice for businesses of all sizes.
Is Power BI in Demand in 2023?
Absolutely!
Power BI has demonstrated strong growth in market share and popularity, with millions of users worldwide.
The demand for Power BI-certified professionals is high, especially in multinational and large corporations. These companies also offer handsome salaries and rewarding career opportunities.
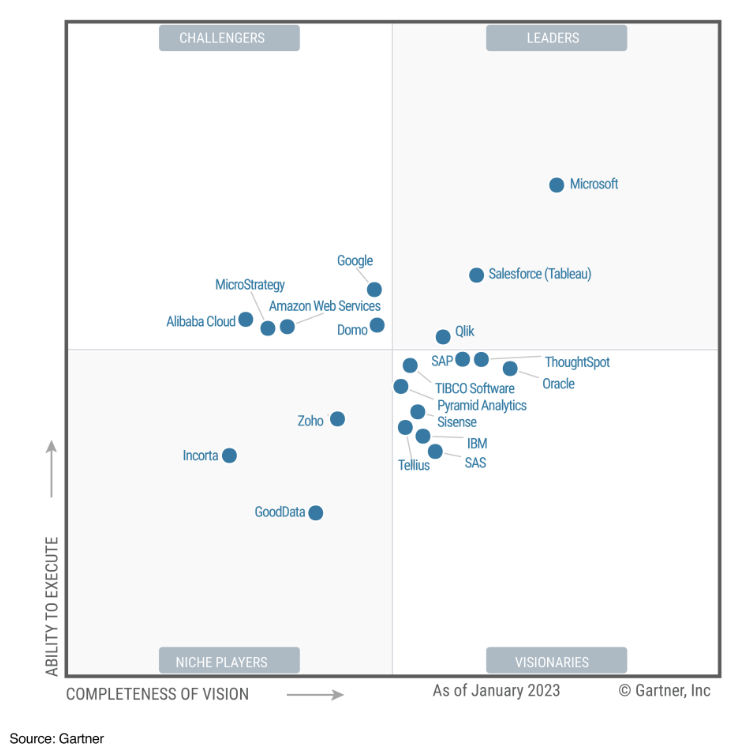
If we look at Tableau vs Power BI Gartner’s Magic Quadrant data in 2023, Power BI is the leader in the Analytics and Business Intelligence Platforms category, followed by Tableau. This indicates ongoing relevance and demand for Power BI in the marketplace.
Here’s another point. Power BI updates every month with almost 5-15 new features. This suggests that as a tool, Power BI will continue to evolve and adapt to the changing needs of businesses.
Given the current trends and future projections, Power BI is not just in high demand in 2023 but is expected to remain relevant for many years to come.
Is It Better To Learn Tableau or Power BI?
Both tools are in high demand. Learning either (or both) could benefit your career or open up new opportunities for your business.
Given current market trends, however, it is clear that Power BI is ascending and Tableau is waning. Our company, for instance, has its choice of tools to use, and we have opted to specialize in Power BI and avoid Tableau — both because our customers need the full power and flexibility of Power BI, and because we believe Power BI has a much brighter future than Tableau. So if you can only learn one, we recommend learning Power BI.
There are some online resources where you can find a Tableau or Power BI tutorial.
Power BI: Try Microsoft’s introductory tutorial on getting started with Power BI. You can also learn from YouTube tutorials and course platforms like Microsoft Learn and DataCamp. In addition, take a look at our blog for articles on Power BI or reach out to us as we offer training and expertise.
Tableau: Tableau’s official website provides free training videos to learn Tableau. Again, you can also find tutorials on YouTube and many course platforms.

What Is the Difference Between Tableau and Power BI Filters?
Filtering is a fundamental function of any data analysis and visualization tool, so it’s unsurprising that both Power BI and Tableau offer robust capabilities in this space. Both tools support pre-filtering the data from the source, for starters, preemptively removing certain data from the analysis space altogether (although it should be noted that even here Power BI has an advantage thanks to Power Query). They both also support security-driven filtering, which prevents users from seeing data outside of their relevant business scope (such as seeing their peers’ sensitive performance data).
Within the visual canvas of a dashboard or report, Power BI and Tableau also both support interactive filtering across visuals, wherein the user for instance clicks a single bar in a bar chart, and the rest of the visuals on the page react and filter down to just that segment. Furthermore they both also allow the user (or report designer) to pre-set desired filters on specific visuals, entire pages, or entire collections of pages. The differences between the tools is negligible in this space.
Power BI, however, adds one additional filtering capability in that the DAX formula language allows precise and flexible filtering to be applied within specific calculations, without requiring the user to take any action and without impacting any other aspects of the report or dashboard.
Does Tableau Have DAX (Data Analysis Expression)?
Tableau doesn’t have DAX.
DAX, or Data Analysis Expression, is a formula language used in Power BI. It allows for complex data manipulation. DAX formulas are very similar to Excel formulas. A few examples of DAX formulas are functions like CALCULATE() and SUMX().
Tableau uses its own calculation language. It’s not as powerful or as flexible as DAX – again it’s optimized to do certain common things simply, but business needs almost immediately exceed its capabilities.
DAX is more powerful and more potent than Tableau’s offering. And here’s an interesting fact: Microsoft has made data modeling and DAX accessible to their entire power platform, including backend and data engineering.
Microsoft’s new initiative, Fabric, aims to empower “citizen developers” to create new business apps. Being a part of Fabric, Power BI, with its accessible DAX and data modeling tools, makes it a more versatile option for data analysis and visualization over Tableau.
Should I Use Python in Power BI?
Power BI lets you use Python scripts to manipulate data and boost your processing capabilities. With Python’s libraries like Pandas and Matplotlib, you can level up your data analysis and visualization process.
However, if Python is not your thing, no problem. With Power BI’s built-in features, you can still handle most data visualization tasks without Python.
So, should you use Python in Power BI? It depends on your needs and skills. If you’re a Python expert, it can enhance your data analysis. If not, Power BI’s native features are also enough.
How P3 Can Help With Data Visualization and More
We’ve discussed different aspects of Tableau and Power BI, including their ease of use, cost, usability, and more.
So which one should you choose? While Power BI Premium is a great option, ultimately, the answer depends on your business needs, budget, and analytics objectives. But you don’t have to decide on your own. If you need more guidance, let us help you.
Our Power BI consulting experts can help you determine if Power BI is the right tool for you and how to wield its power to unlock business insights for your business. Contact us today and take the first step towards a more data-empowered future!
Get in touch with a P3 team member