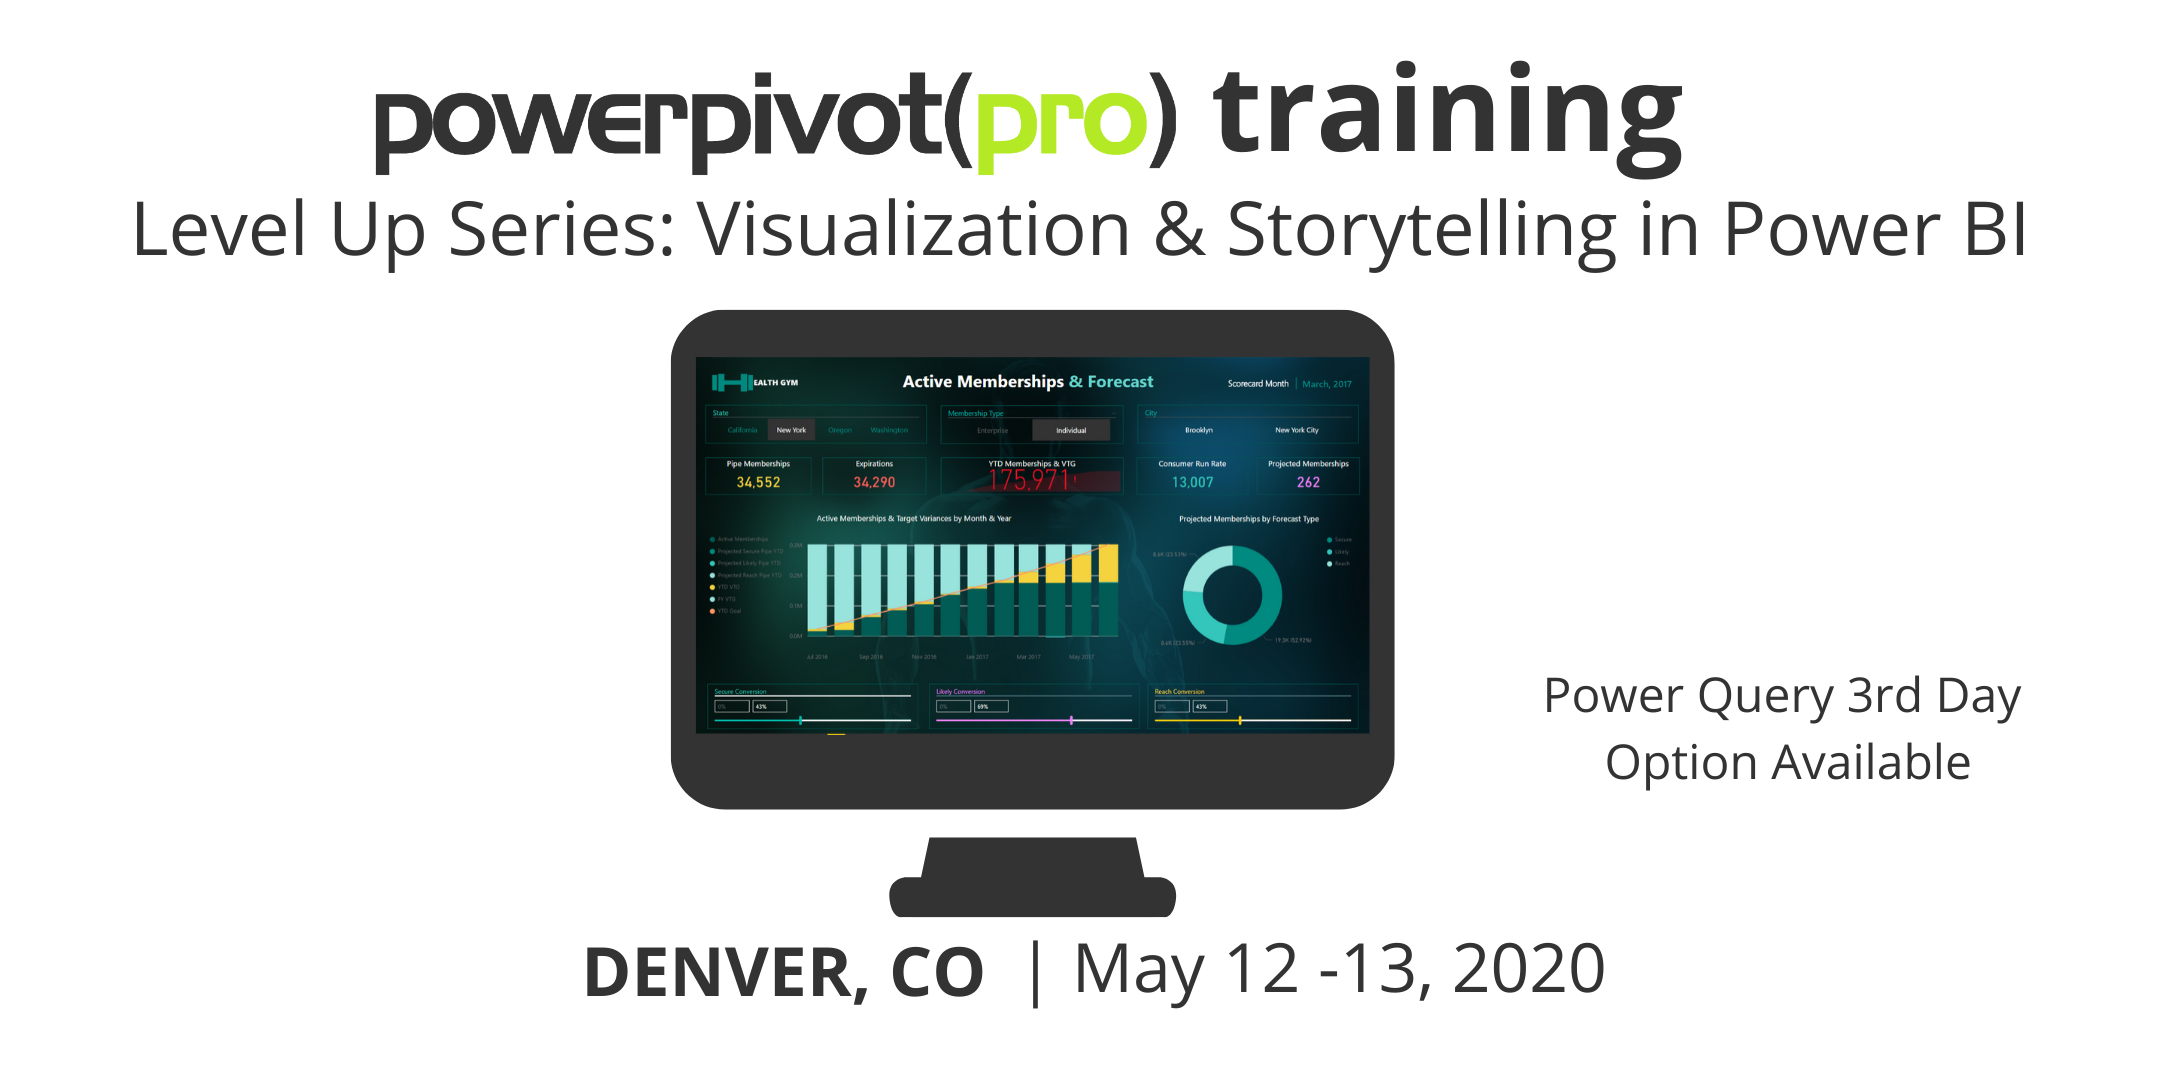
Level Up Series: Visualization & Storytelling in Power BI

Serendipity Labs 1801 Wewatta Street 11th Floor, Denver, CO 80202, Denver, CO, US

Master the last mile of business intelligence reporting with compelling visualizations and epic storytelling techniques. Liberate yourself from default settings and explore all the ways Power BI can deliver jaw-dropping insights. ** Use the discount code "3ORMORE" when signing up 3 or more people for a 10% discount. ** If you sign up for the extra Power Query day, we will manually add you to the class. Two Days in our class and you are EMPOWERED! Learn the in’s and out’s of Power BI’s visualization and report design features Evolve default visuals into powerful custom storytelling elements Implement design choices that enhance and enrich the user experience No DAX or data modeling experience needed. Art degrees are similarly unnecessary. Who Can Benefit? Users of Power BI, especially those responsible for reporting and analysis. Business leaders who need dashboards and reports that do more than report the news Organizations looking to […]
Level Up Series: Visualization & Storytelling in Power BI

Master the last mile of business intelligence reporting with compelling visualizations and epic storytelling techniques. Liberate yourself from default settings and explore all the ways Power BI can deliver jaw-dropping insights. ** Use the discount code "3ORMORE" when signing up 3 or more people for a 10% discount. ** If you sign up for the extra Power Query day, we will manually add you to the class. Two Days in our class and you are EMPOWERED! Learn the in’s and out’s of Power BI’s visualization and report design features Evolve default visuals into powerful custom storytelling elements Implement design choices that enhance and enrich the user experience No DAX or data modeling experience needed. Art degrees are similarly unnecessary. Who Can Benefit? Users of Power BI, especially those responsible for reporting and analysis. Business leaders who need dashboards and reports that do more than report the news Organizations looking to […]
Level Up Series: Visualization & Storytelling in Power BI – May

Master the last mile of business intelligence reporting with compelling visualizations and epic storytelling techniques. Liberate yourself from default settings and explore all the ways Power BI can deliver jaw-dropping insights. ** Use the discount code "3ORMORE" when signing up 3 or more people for a 10% discount. A single day in our class and you are EMPOWERED! Learn the in’s and out’s of Power BI’s visualization and report design features Evolve default visuals into powerful custom storytelling elements Implement design choices that enhance and enrich the user experience No DAX or data modeling experience needed. Art degrees are similarly unnecessary. Who Can Benefit? Users of Power BI, especially those responsible for reporting and analysis. Business leaders who need dashboards and reports that do more than report the news Organizations looking to leverage Microsoft’s groundbreaking Power BI offerings more thoroughly. Business Intelligence and Database professionals looking to increase their design […]

Level Up Series: Visualization & Storytelling in Power BI – June

Master the last mile of business intelligence reporting with compelling visualizations and epic storytelling techniques.Master the last mile of business intelligence reporting with compelling visualizations and epic storytelling techniques. Liberate yourself from default settings and explore all the ways Power BI can deliver jaw-dropping insights.** Use the discount code "3ORMORE" when signing up 3 or more people for a 10% discount.A single day in our class and you are EMPOWERED!Learn the in’s and out’s of Power BI’s visualization and report design featuresEvolve default visuals into powerful custom storytelling elementsImplement design choices that enhance and enrich the user experienceNo DAX or data modeling experience needed. Art degrees are similarly unnecessary.Who Can Benefit?Users of Power BI, especially those responsible for reporting and analysis.Business leaders who need dashboards and reports that do more than report the newsOrganizations looking to leverage Microsoft’s groundbreaking Power BI offerings more thoroughly.Business Intelligence and Database professionals looking to […]

Level Up Series: Visualization & Storytelling in Power BI – August

Master the last mile of business intelligence reporting with compelling visualizations and epic storytelling techniques.Master the last mile of business intelligence reporting with compelling visualizations and epic storytelling techniques. Liberate yourself from default settings and explore all the ways Power BI can deliver jaw-dropping insights.** Use the discount code "3ORMORE" when signing up 3 or more people for a 10% discount.A single day in our class and you are EMPOWERED!Learn the in’s and out’s of Power BI’s visualization and report design featuresEvolve default visuals into powerful custom storytelling elementsImplement design choices that enhance and enrich the user experienceNo DAX or data modeling experience needed. Art degrees are similarly unnecessary.Who Can Benefit?Users of Power BI, especially those responsible for reporting and analysis.Business leaders who need dashboards and reports that do more than report the newsOrganizations looking to leverage Microsoft’s groundbreaking Power BI offerings more thoroughly.Business Intelligence and Database professionals looking to […]

Level Up Series: Visualization & Storytelling in Power BI – November

Master the last mile of business intelligence reporting with compelling visualizations and epic storytelling techniques.Master the last mile of business intelligence reporting with compelling visualizations and epic storytelling techniques. Liberate yourself from default settings and explore all the ways Power BI can deliver jaw-dropping insights.** Use the discount code "3ORMORE" when signing up 3 or more people for a 10% discount.A single day in our class and you are EMPOWERED!Learn the in’s and out’s of Power BI’s visualization and report design featuresEvolve default visuals into powerful custom storytelling elementsImplement design choices that enhance and enrich the user experienceNo DAX or data modeling experience needed. Art degrees are similarly unnecessary.Who Can Benefit?Users of Power BI, especially those responsible for reporting and analysis.Business leaders who need dashboards and reports that do more than report the newsOrganizations looking to leverage Microsoft’s groundbreaking Power BI offerings more thoroughly.Business Intelligence and Database professionals looking to […]

Level Up Series: Visualization & Storytelling in Power BI – April

Master the last mile of business intelligence reporting with compelling visualizations and epic storytelling techniques. Master the last mile of business intelligence reporting with compelling visualizations and epic storytelling techniques. Liberate yourself from default settings and explore all the ways Power BI can deliver jaw-dropping insights. ** Use the discount code "3ORMORE" when signing up 3 or more people for a 10% discount. A single day in our class and you are EMPOWERED! Learn the in’s and out’s of Power BI’s visualization and report design features Evolve default visuals into powerful custom storytelling elements Implement design choices that enhance and enrich the user experience No DAX or data modeling experience needed. Art degrees are similarly unnecessary. Who Can Benefit? Users of Power BI, especially those responsible for reporting and analysis. Business leaders who need dashboards and reports that do more than report the news Organizations looking to leverage Microsoft’s groundbreaking […]

Level Up Series: Visualization & Storytelling in Power BI – August

Master the last mile of business intelligence reporting with compelling visualizations and epic storytelling techniques.Master the last mile of business intelligence reporting with compelling visualizations and epic storytelling techniques. Liberate yourself from default settings and explore all the ways Power BI can deliver jaw-dropping insights.** Use the discount code "3ORMORE" when signing up 3 or more people for a 10% discount.A single day in our class and you are EMPOWERED!Learn the in’s and out’s of Power BI’s visualization and report design featuresEvolve default visuals into powerful custom storytelling elementsImplement design choices that enhance and enrich the user experienceNo DAX or data modeling experience needed. Art degrees are similarly unnecessary.Who Can Benefit?Users of Power BI, especially those responsible for reporting and analysis.Business leaders who need dashboards and reports that do more than report the newsOrganizations looking to leverage Microsoft’s groundbreaking Power BI offerings more thoroughly.Business Intelligence and Database professionals looking to […]

Level Up Series: Visualization & Storytelling in Power BI – October

Master the last mile of business intelligence reporting with compelling visualizations and epic storytelling techniques. Master the last mile of business intelligence reporting with compelling visualizations and epic storytelling techniques. Liberate yourself from default settings and explore all the ways Power BI can deliver jaw-dropping insights. ** Use the discount code "3ORMORE" when signing up 3 or more people for a 10% discount. **Ticket Sales End 10/18. A single day in our class and you are EMPOWERED! Learn the in’s and out’s of Power BI’s visualization and report design features Evolve default visuals into powerful custom storytelling elements Implement design choices that enhance and enrich the user experience No DAX or data modeling experience needed. Art degrees are similarly unnecessary. Who Can Benefit? Users of Power BI, especially those responsible for reporting and analysis. Business leaders who need dashboards and reports that do more than report the news Organizations looking […]

Level Up Series: Visualization & Storytelling in Power BI – December

Master the last mile of business intelligence reporting with compelling visualizations and epic storytelling techniques.Master the last mile of business intelligence reporting with compelling visualizations and epic storytelling techniques. Liberate yourself from default settings and explore all the ways Power BI can deliver jaw-dropping insights.* Use the discount code "3ORMORE" when signing up three or more people for a 10% discount.** Early Bird Discount ends on 11/19 (three weeks before class week)*** Ticket Sales End 12/14.Visualizations & Storytelling in Power BI: Friday, December 15thA single day in our class, and you are EMPOWERED!Learn the ins and outs of Power BI’s visualization and report design featuresEvolve default visuals into powerful custom storytelling elementsImplement design choices that enhance and enrich the user experienceNo DAX or data modeling experience is needed. Art degrees are similarly unnecessary.Who Can Benefit?Users of Power BI, especially those responsible for reporting and analysis.Business leaders who need dashboards and […]