
Are you excited to explore the world of Power BI Desktop and unlock its full potential for data visualization? Whether you’re a business analyst or data scientist considering hiring a Power BI consulting firm or just curious about harnessing the power of data, this guide is your gateway to understanding Power BI Desktop. Let’s kick off our journey by delving into what Power BI is and why it’s such a valuable tool in the realm of data analytics. If you want to learn more about Power BI Desktop, you’re in the right place.
What Is Power BI and Why Is It Useful?
Power BI is a suite of powerful business analysis tools developed by Microsoft. It’s most well known for its ability to assist organizations in making decisions based on data from disparate data sources. With Power BI, you can effortlessly connect to various data sources, whether they are spreadsheets, databases, or cloud-based platforms. Once connected, it allows you to take raw, often complex, data and transform it into engaging and easy-to-understand visualizations. These visualizations, which can be in the form of charts, graphs, or Power BI dashboards, are the keys to unlocking insights hidden within your data.
What makes Power BI truly valuable is its capacity to democratize data within your organization. It empowers individuals from various departments to access, analyze, and draw conclusions from data without being data experts. This democratization of data leads to informed, data-driven decision-making, which is crucial in today’s competitive business landscape.
Moreover, Power BI isn’t just about generating insights; it’s about sharing them effectively. You can effortlessly share your reports and dashboards with your team or clients, making collaboration and communication more efficient. Power BI simplifies the process of using data to make informed decisions. It streamlines data access, analysis, visualization, and sharing, making it an invaluable tool for businesses.
What Is Power BI Desktop?
At the heart of the Power BI ecosystem lies Power BI Desktop. Available for free, the Power BI Desktop download found here serves as your canvas for creating interactive Power BI Reports and Power BI Dashboards. With Power BI Desktop, you can effortlessly import data from a multitude of sources, construct robust data models, design visually stunning representations, and weave compelling narratives to effectively communicate your data’s story.
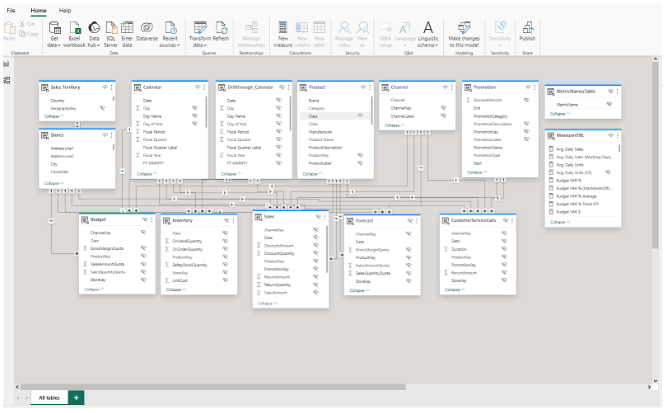
With Power BI Desktop, you have the ability to establish connections with diverse data sources to mold and refine data, establish relationships between tables, and define calculated columns and measures to create a data model. This data model acts as the foundation upon which you can build visual representations, providing unparalleled flexibility in working with intricate datasets to find and extract valuable insights.
Within the toolkit of Power BI Desktop, you’ll also find indispensable tools like Data Analysis Expressions (DAX) and Power Query. DAX facilitates the creation of custom calculations and aggregations, while Power Query streamlines data extraction, transformation, and preparation. These tools are critical to mastering advanced data manipulation.
What Is Power BI Desktop Used for?
Power BI Desktop serves as your initial analytics tool for building foundational data models, analytical calculations, and interactive visualizations. It’s tailor-made for data professionals seeking to build custom Power BI Dashboards, conduct in-depth data analysis, and reveal actionable insights. Whether your data originates from spreadsheets, databases, or cloud services, Power BI Desktop delivers a seamless platform for data preparation and presentation.
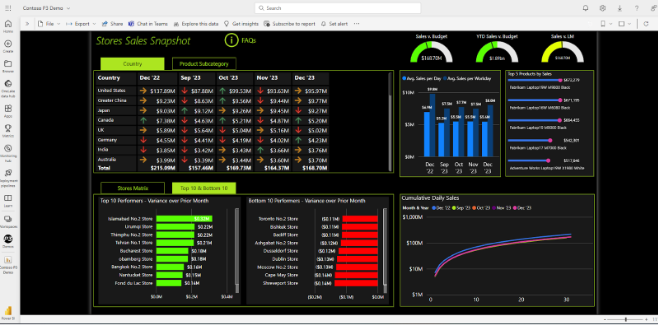
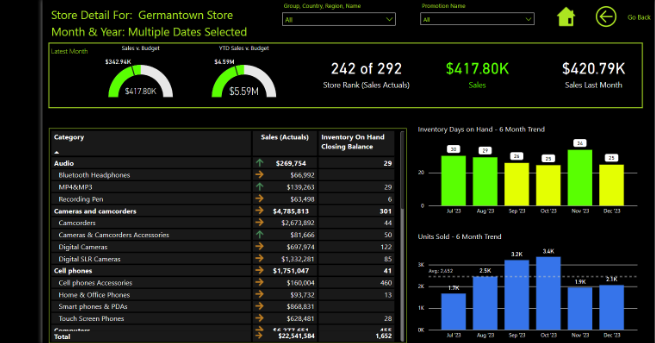
Interactive Data Visualizations
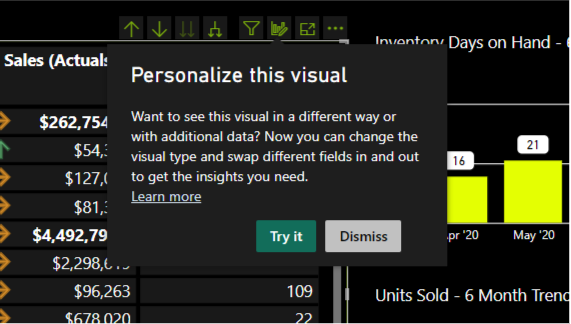
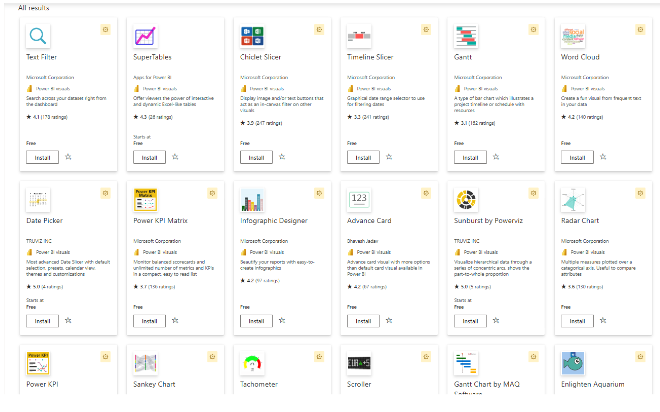
Within Microsoft Power BI Desktop’s arsenal, you’ll discover a diverse range of visual elements, including customizable charts, graphs, tables, and maps. These elements allow you to breathe life into your data, creating interactive Power BI Reports that empower users to explore, drill down into details, and effortlessly unearth insights. In addition to the pre-packaged visual elements, Power BI Desktop users can create custom visuals or download validated visuals from AppSource. These visuals are built by Microsoft or trusted Microsoft partners and can be downloaded directly to your Visualizations pane.
Storytelling with Data
Power BI Desktop goes beyond visualizations; it equips you with the tools necessary to become a storyteller with data. Within your reports, you have the ability to seamlessly incorporate narrative elements, detailed explanations, and insightful annotations, all aimed at guiding users through the compelling narrative of your data insights.
Once you have uncovered a compelling trend or made an important discovery in your data, you can not only showcase the visual evidence but also offer context to ensure that your audience not only sees the data but also understands the story it tells. Storytelling features such as text boxes, callouts, tooltips, and interactive elements take your reports from informative presentations to engaging narratives that drive better understanding and decision-making.
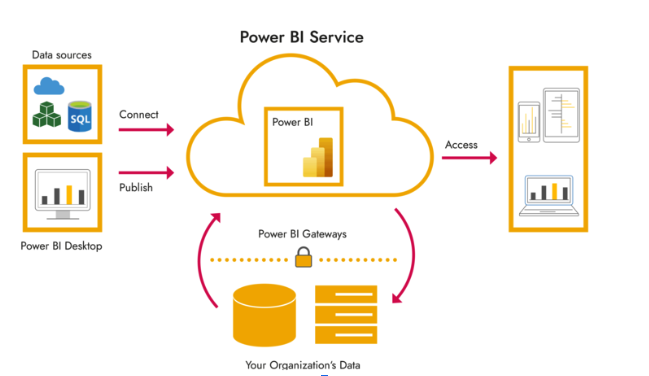
What Is Power BI Service Used for?
Power BI Desktop is the foundational workhorse behind the analytical powerhouse where the heavy lifting of data modeling occurs. By contrast, Power BI Service is the cloud-based counterpart to Power BI Desktop, specializing in sharing and collaborating on reports and dashboards. By utilizing Power BI online, you can effortlessly publish your Power BI Desktop creations to the cloud, making them accessible to colleagues and stakeholders, even on the go.
Power BI Service redefines collaboration by offering seamless sharing capabilities. After you’ve created reports and dashboards in the desktop application, utilizing a Power BI Pro license, you can share them with stakeholders, who can access them through a web browser or mobile app. This real-time sharing ensures everyone works with the latest data.
Power BI Service also brings automation to the forefront with scheduled data refresh capabilities. It ensures your reports remain perpetually up-to-date with the latest data from diverse sources, saving time and ensuring accuracy in reporting.
When Would You Use Power BI Service Rather Than Power BI Desktop?
When it comes to choosing between Power BI Service and Power BI Desktop, your decision hinges on specific factors that align with your organizational needs and goals. Power BI Service emerges as the optimal choice in scenarios where the aim is to distribute reports and dashboards to a broader audience, foster real-time data sharing, enable scheduled data refreshes, and ensure accessibility from a multitude of devices. This cloud-based solution perfectly caters to businesses seeking seamless collaboration and empowering remote teams with convenient access to valuable insights.
Power BI Service offers unmatched accessibility, making it an invaluable asset for organizations with remote teams or employees who require on-the-go access to their reports and dashboards. In today’s dynamic work environment, where professionals are no longer confined to their desks, the ability to access critical insights from anywhere is paramount.
To work with Power BI online, all you need is an internet connection and a Power BI login, and you can tap into your data resources on various devices, including laptops, tablets, and smartphones. Moreover, Power BI Service’s responsive design ensures that the reports and dashboards you’ve created in the desktop environment adapt seamlessly to different screen sizes. Whether you’re viewing them on a large desktop monitor or a small mobile screen, the user experience remains intuitive and informative.
What Is a Key Advantage of Power BI Service Over Power BI Desktop?
The most significant advantage of Power BI Service is its capacity to deliver real-time data updates and foster collaboration. While Power BI Desktop excels in individual report creation, using Power BI online can elevate teamwork by allowing multiple users to collaborate on the same dataset.
In Power BI Service, workspaces serve as collaborative hubs where teams can efficiently share ownership and management of Power BI dashboards, reports, semantic models, and workbooks. These workspaces can be organized based on organizational structure, project, or to store different versions of reports—ensuring flexibility in collaboration.
Roles within workspaces define the permissions colleagues have, allowing you to manage who can edit, distribute, or simply view content. This role-based access streamlines collaborative efforts and ensures data security.
In addition, Power BI Service actively encourages data exploration, allowing users with a Power BI Pro license to interact with reports, apply filters, and organically unearth insights. Whether you’re identifying anomalies, spotting trends, or conducting KPI analysis, these insights drive data discovery across all levels of your organization. This capability ensures that you remain up-to-date with the latest data-driven insights, enhancing your decision-making process and fostering a deeper understanding of your data.
What Is the Difference Between Power BI and Power BI Desktop?
In the world of data analysis and business intelligence, Power BI refers to a suite of useful tools from Microsoft. This suite includes Power BI Desktop, Power BI Service, and Power BI Mobile. Think of it as a trio of tools, each with its own role. When we say Power BI, we’re talking about this whole package. But when we say Power BI Desktop, we’re specifically talking about the tool you use on your computer to create reports and analyze data.
Power BI Desktop: Where Data Magic Happens
Imagine Power BI Desktop as your personal creative space for working with data. It’s like your digital canvas for creating reports and understanding your information better. With this tool, you can bring in data from different sources, create interactive visualizations, and tell data stories. It’s all about diving deep into your data right on your computer.
Power BI: The Bigger Picture
But remember, Power BI isn’t just about what you do on your computer. It’s a whole system. In this system, there’s Power BI Service, which lives in the cloud and helps you collaborate with others and share your work. Then there’s Power BI Mobile, which lets you take your data with you on your phone or tablet through the app with your Power BI login.
So, when we say Power BI, we mean this entire setup that covers everything from data analysis to teamwork and mobile access. Power BI Desktop is just one part of the whole Power BI world. Understanding this helps you make the most of these tools and get the insights you need for your business.
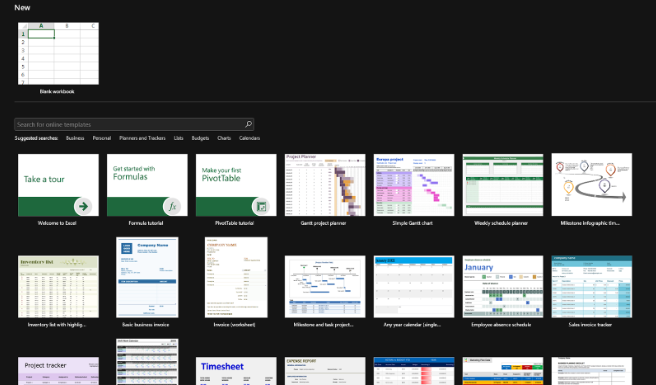
What Is the Difference Between Excel and Power BI Desktop?
Excel and Power BI Desktop are both formidable data analysis tools, but they distinguish themselves in distinct ways. Excel primarily operates as a spreadsheet application, while Power BI Desktop specializes in rich data visualization and reporting. Power BI Desktop offers advanced capabilities for data modeling, interactive visuals, and the seamless sharing of reports, rendering it the preferred choice for complex data analysis and reporting requirements.
Excel’s strength lies in calculations, static reports, and tabular data. In contrast, Power BI Desktop stands out in dynamic data exploration, the creation of interactive dashboards, and sharing insights with a broader audience. While Excel remains an invaluable tool, Power BI Desktop goes beyond basic data analysis.
Is Power BI Desktop Still Free?
Power BI Desktop remains a free application, allowing users the ability to build comprehensive data models, interactive reports, and custom dashboards at no cost. Microsoft’s unwavering commitment to providing a free, robust data analysis tool ensures that both businesses and individuals can harness the power of data.
However, it’s important to note that while Power BI Desktop is free, there are additional considerations when it comes to sharing and collaborating in Power BI online. To effectively share your reports, collaborate with colleagues, and access certain advanced features, you’ll need a Power BI Pro license. This license empowers users with the ability to seamlessly collaborate and share insights within their organization. It’s a vital component for businesses that seek to harness the full potential of Power BI for team collaboration and data-driven decision-making.
In conclusion, Microsoft Power BI is a game-changer in the realm of data visualization. It empowers you to uncover insights, make data-driven decisions, and effortlessly share your discoveries. Whether you’re just starting your journey as a data analyst or are an experienced professional looking to take your skills to the next level, Power BI Desktop is a powerful asset in your toolkit. Start your data visualization journey by downloading Power BI app today and witness the transformative power of data visualization. If you need expert guidance or have questions, don’t hesitate to reach out to P3 Adaptive. Our experts are ready to jumpstart your data projects and help you build a thriving Power BI culture within your organization.
Get in touch with a P3 team member