“IT’S ALIVE!!!!”
(Just your average Excel Pro after converting
his first PowerPivot Workbook into a Web App)
I’ve got another article about to go live on CIMA Insight, but I’m gonna jump the gun a bit and post basically the entire thing here ahead of time.
***UPDATE: I am no longer working at Pivotstream and do not endorse their services. All links are removed from this article but feel free to look them up if you are interested.
At Pivotstream we recently went live with our first full-time demo site for Hosted PowerPivot. We’re going to be adding to it over time, but it’s got enough on it already that I think it’s worth looking at – it shows that “spreadsheets have become live web applications” thing that has to be seen, live, to really sink in.
Customizable Homepage

Pretty self-explanatory – customizable content plus a menu of applications. Link below.
(OK, one note: I say “customizable” but customization is only allowed for Authors/Owners of the site. What you are seeing here in the Consumer experience, and Consumers cannot customize this home page).
App #1: Based on Microsoft’s “AdventureWorks” Sample Data Set
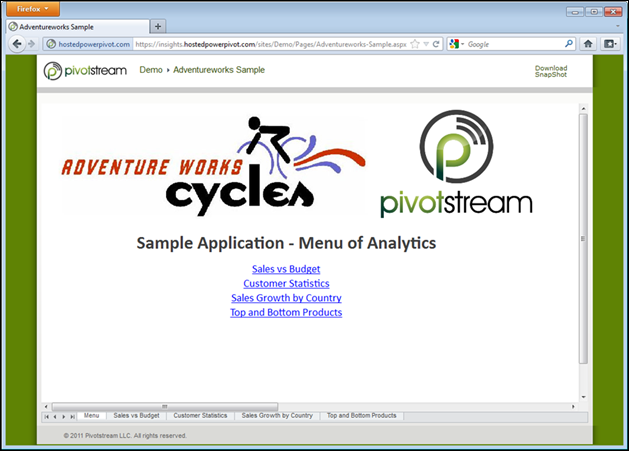
This is the workbook from the Budget vs. Actuals Part One and Part Two posts. Here’s a picture of that same workbook after it’s been saved to a SharePoint web server and then accessed in my browser:
Notes on this application:
- This is just an XLSX file, created with PowerPivot and then saved to the server
- But it’s rendering in my browser (Firefox in this case), and the XLSX is NOT being downloaded to my computer
- I do NOT have to have Excel installed on my computer in order for this browser application to function
- This picture is of the menu page of the app, which is just a worksheet with the gridlines and headers turned off
- The graphics are two image files inserted into the sheet via Insert.Picture on the ribbon
- The four hyperlinks are merely links to other worksheets within the workbook
If I click the “Sales vs. Budget” hyperlink, I am taken to the report I built in last month’s article:
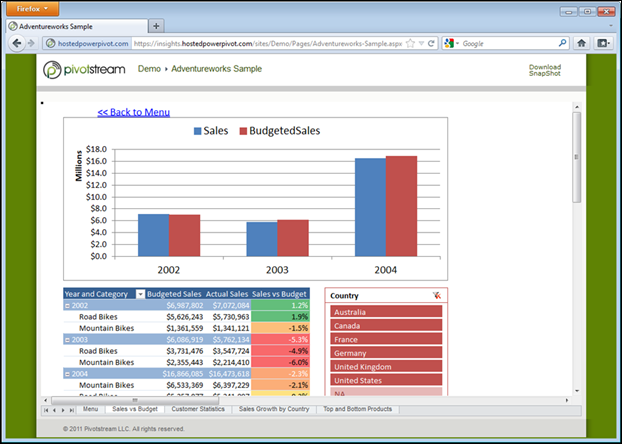
Click the slicer – it works ![]()
Application #2: Retailer Overlap Competitive Analysis
This application is based on two real-world data sets. One is a list of the addresses of almost every retail food/drug store in the United States. The other is a detailed list of demographic information about every ZIP code (postal code) in the United States.
Blend them together in PowerPivot and you get an application like this:
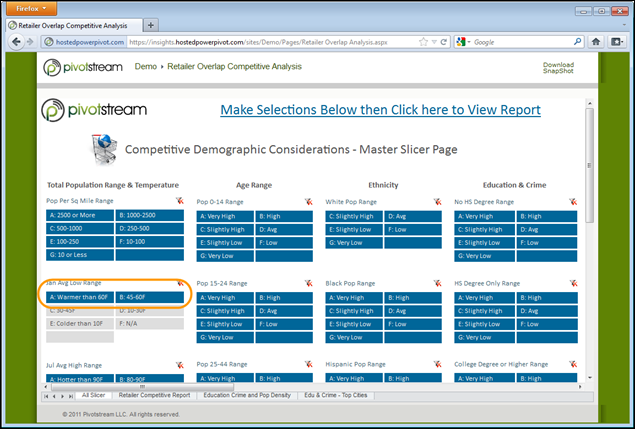
Note that I have selected the two warmest temperature ranges, circled in orange. If I click the link at the top of the sheet I then see the following analysis:
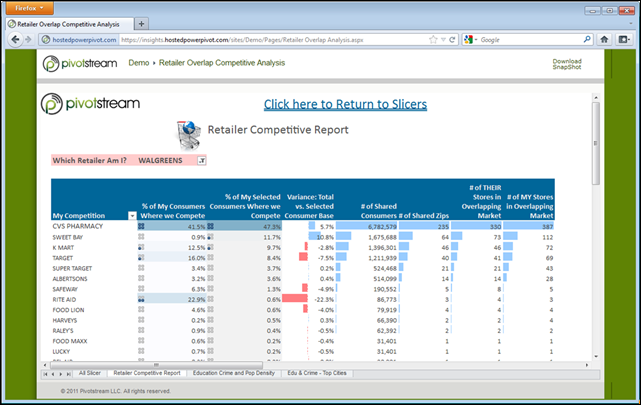
Notes:
- I have the application set as if “I” were Walgreens, and evaluating my competitors’ geographic overlap with my Walgreens retail locations
- The first column indicates to me that CVS competes with me (Walgreens) for 41.5% of the potential customers that I try to reach
- In other words, 41.5% of the people who live near a Walgreens also live near a CVS
- The second column reports that Walgreens competes with me for 47.3% of my customers in Warm locations
- So the first column ignores the slicer selections I made on the menu page, and the second column respects them!
- The third column represents the delta between columns 1 and 2. Interesting, for instance, that Rite Aid does NOT compete with me at all really in warm locations
- Try it out, slice away – there are many ways to slice and analyze this data set
Application #3: CRM Analyzer
This one is also based off of a sample data set, but it is one pulled from a popular CRM package and therefore represents real-world value.
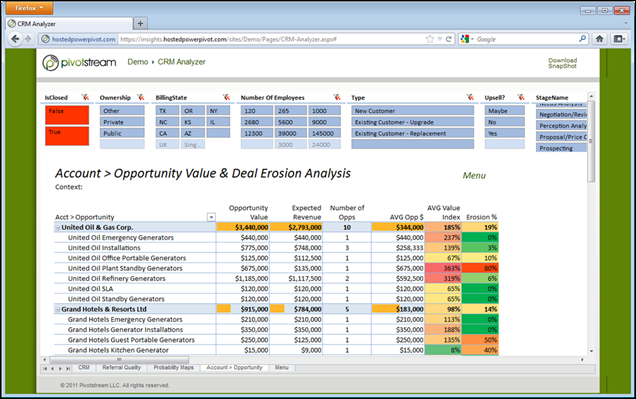
Note that there are multiple reports in this application as well, plus a menu page, but I’m just showing one here for space reasons.
Application #4: UFO Sightings
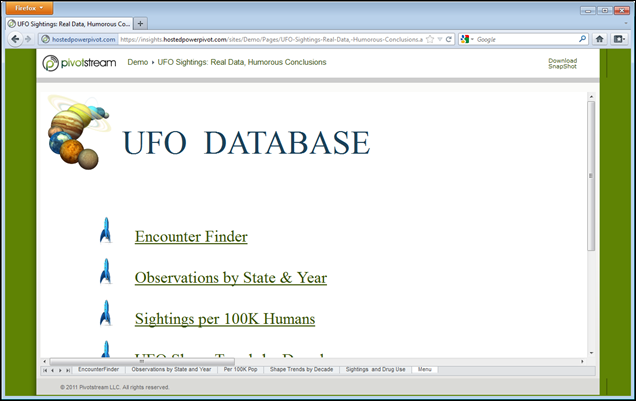
Many of you have seen this one already, on Mr. Excel’s Hosted PowerPivot site, but we put it on this demo site as well.
