
To set the stage, I need you to travel back in time with me a bit.
The year was 2019, and none of us had ever heard of COVID-19…those were simpler times.
I was working on a data model that had A LOT of dates in the data table. By a lot, I mean 10 different dates in a single transaction table. I was trying to build a model that would be able to answer any question that the users would ever ask, so I ended up including all 10 different dates. The problem came when I started building out my relationships between my data table and my calendar table. Power BI would only let me have 1 active relationship between the data table and the calendar table…but I had 10 dates that I wanted to relate to the calendar table.
As all good developers do, I went to the inter-webs for help.i (In the back of my mind, I knew the answers I was going to find, but I was hoping to find some magical solution.) Sure enough, the web returned the two options that I was hoping to avoid: either create (9) copies of my calendar table to match the number of dates I had in my data table (gross), or create 9 inactive relationships between my calendar table and activate those relationships via DAX (less gross, but still not ideal). Let’s say I had 5 base measures in that model. I would have to create 9 copies of each of those measures, activating each of the inactive relationships to the calendar table. My 5 measures quickly would have become 50 different measures. That felt too bulky and confusing for report authors.
I didn’t like either of my options, so I took a stab in the dark and started emailing Power BI and data modeling experts asking for advice. One was gracious enough to respond, confirming the two options that I already didn’t like, but he did offer a third solution:
Calculation Groups
I read what I could find about Calculation Groups, and they sounded incredible! Unfortunately for me, they were not available in Power BI, and I didn’t have access to Azure Analysis Services or Analysis Services 2019. Calculation Groups seemed like a magical unicorn that was too good to be true, especially because they seemed to solve my exact problem, but I couldn’t use them.
Let’s jump back in our time machine and return to the present-day. Unfortunately, we’ve all now heard of COVID-19, but it isn’t the only thing that popped up in 2020. Calculation Groups are now out in the wild and available in Power BI, with the help of Tabular Editor!
I have since moved on from that 2019 model with 10 dates, but I have a new model that has similar issues that Calculation Groups can now solve!
Let’s take a look at my model:
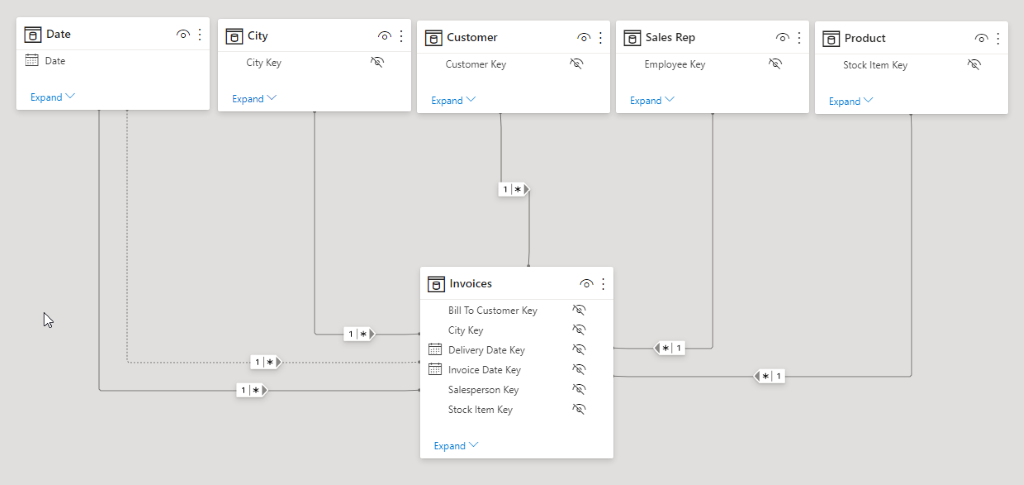
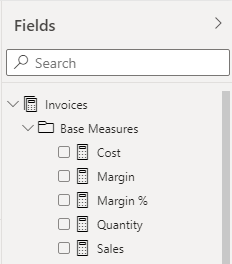
It is a fairly simple model, and I only have 5 base measures to start with:
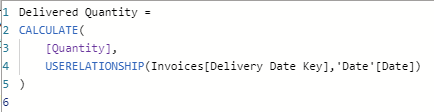
If you look closely at the model view, you’ll see that there is an inactive relationship between Date and Invoices, because my Invoices table has Invoice Date and Delivery Date. Well, now I need to create a copy of my 5 base measures (CALCULATE…USERELATIONSHIP), so that report authors can look at each of them by either Invoice Date or Delivery Date.

Ok, 10 measures isn’t that bad…I can manage that. But…I also want to do some time intelligence analysis, things like prior year, this year – last year, % growth, MTD, QTD, YTD. I feel like I’m back in 2019 again because my 5 base measures turned into 10, and then with the addition of time intelligence, I’m at 70 measures!
Unlike in 2019 though…Calculation Groups actually do come to the rescue!!!
With the help of Calculation Groups, I am going to keep my measure count to the 5 base measures that I started with, but I am going to add a Calculation Group to handle my time intelligence and a Calculation Group to handle my inactive Delivery Date relationship.
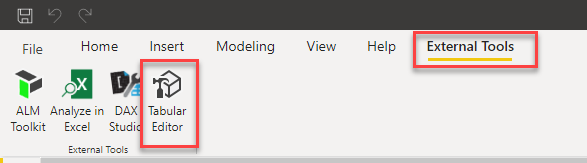
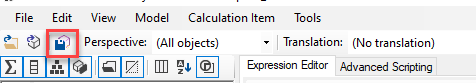
I start by launching Tabular Editor from the External Tools ribbon in Power BI Desktop.
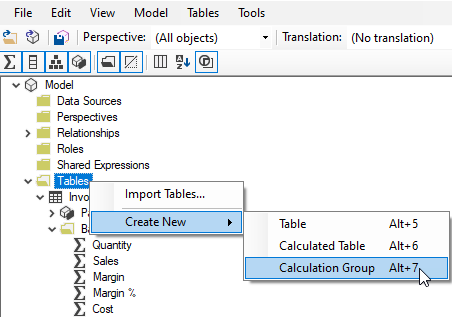
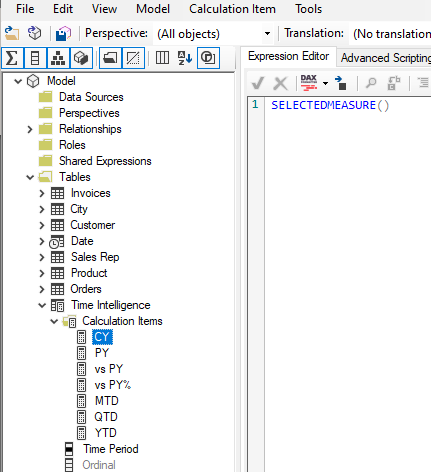
Once Tabular Editor opens, I right click on Tables and create a new Calculation Group, which I name Time Intelligence.
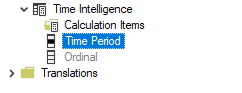
I also rename the column from Name to Time Period.
Next, I right click on Calculation Items
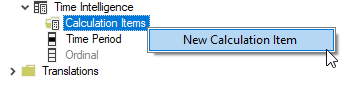
and create the following items.
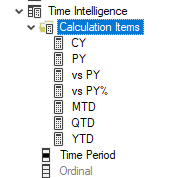
Below is the DAX expression for each of those Calculation Items:
| Calculation Item | DAX Expression |
| CY | SELECTEDMEASURE() |
| PY | CALCULATE ( SELECTEDMEASURE (), SAMEPERIODLASTYEAR ( ‘Date'[Date] ) ) |
| vs PY | VAR _CY = SELECTEDMEASURE () VAR _PY = CALCULATE ( SELECTEDMEASURE (), SAMEPERIODLASTYEAR ( ‘Date'[Date] ) ) VAR Result = _CY – _PY RETURN Result |
| Vs PY% | VAR _CY = SELECTEDMEASURE () VAR _PY = CALCULATE ( SELECTEDMEASURE (), SAMEPERIODLASTYEAR ( ‘Date'[Date] ) ) VAR Result = DIVIDE ( _CY – _PY, _PY ) RETURN Result |
| MTD | CALCULATE ( SELECTEDMEASURE (), DATESMTD ( ‘Date'[Date] ) ) |
| QTD | CALCULATE ( SELECTEDMEASURE (), DATESQTD ( ‘Date'[Date] ) ) |
| YTD | CALCULATE ( SELECTEDMEASURE (), DATESYTD ( ‘Date'[Date] ) ) |
(The SELECTEDMEASURE() in each of the Calculation Items is kind of like a placeholder. It means that the logic of the Calculation Item will end up being applied to whatever measure I end up visualizing in the report.)
That’s a great start!
Now I can save my changes in Tabular Editor and refresh those changes in Power BI Desktop.

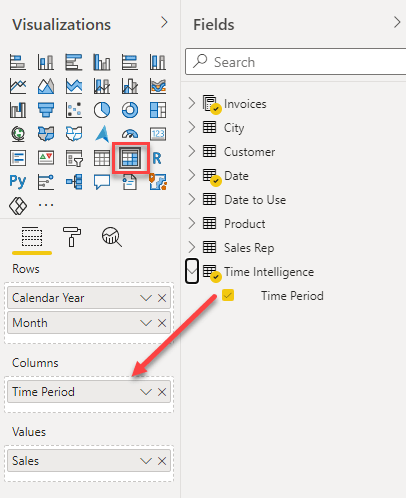
Now that I have my Time Intelligence Calculation Group/Items in Power BI Desktop, I can use the Time Period column in a slicer and/or as a column in a matrix. (I’m putting Sales as the measure in the values of the matrix. Because the Calculation Items have that SELECTEDMEASURE() placeholder, they will be applied to Sales. If I chose to use Quantity instead of Sales, all the time intelligence logic would be applied to Quantity…cool!)
I don’t care who you are, that’s freakin’ awesome!
But…let’s take it a step further. Remember when I mentioned my inactive relationship based on Delivery Date? I can create a Calculation Group to toggle between the active relationship and the inactive relationship.ii
Same steps as before:
Create new Calculation Group, rename column, add Calculation Items:
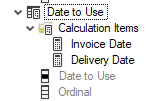
| Calculation Item | DAX Expression |
| Invoice Date | SELECTEDMEASURE() |
| Delivery Date | CALCULATE ( SELECTEDMEASURE (), USERELATIONSHIP ( ‘Invoices'[Delivery Date Key], ‘Date'[Date] ) ) |
(Remember that concept of the SELECTEDMEASURE() placeholder? The Invoice Date Calculation Item isn’t really doing anything, since the relationship based on Invoice Date is the Active relationship. It’s the Delivery Date Calculation Item that is doing something special, in that it is activating the inactive relationship, for the measure(s) in the visual.)
After saving in Tabular Editor and refreshing in Power BI Desktop, I can now add that Date to Use column as a slicer on my report, to toggle between Invoice Date or Delivery Date…and it can work along with my time intelligence Calculation Group!!!
Awesome!
I want to add one last bit of icing on this cake, because I want users to be able to pick which measure(s) they see in the visual. For example, everything up to this point has been looking at Sales, but what if a user wanted to see both Sales and Margin%, but another user just wants to focus on Quantity?
Calculation Groups to the rescue!
Just like before, I open Tabular Editor and create a new Calculation Group, rename column, and add Calculation Items. This time though, I am just going to hard code each of my 5 base measures as Calculation Items.

| Calculation Item | DAX Expression |
| Quantity | [Quantity] |
| Sales | [Sales] |
| Cost | [Cost] |
| Margin | [Margin] |
| Margin% | [Margin %] |
Now with my Choose Measure column from the Measure Picker Calculation Group as a column in my matrix and a slicer on my report, I have a fully dynamic visual, that allows users to pick which measure(s) to see, along with which date relationship, and which time intelligence logic!
i Is a blog post really a blog post without at least one footnote or endnote?
ii When using multiple Calculation Groups together, it is extremely important to pay attention to the Calculation Group Precedence property in Tabular Editor, to ensure that the different Calculation Groups are executed in the correct order. For further reading, see these super helpful posts by SQLBI.
Introducing Calculation Groups – SQLBI
Understanding Calculation Group Precedence – SQLBI
iii One quick note about performance. The USERELATIONSHIP function in DAX disables some optimizations in the Power BI engine, and Time Intelligence calculations like MTD, QTD, and YTD can be non-additive and can create quite a few Storage Engine queries. This combination of Calculation Groups could result in slower performance in a large or complex model.
Microsoft’s platform is the world’s most fluid & powerful data toolset. Get the most out of it.
No one knows the Power BI ecosystem better than the folks who started the whole thing – us.
Let us guide your organization through the change required to become a data-oriented culture while squeezing every last drop* of value out of your Microsoft platform investment.
* – we reserve the right to substitute Olympic-sized swimming pools of value in place of “drops” at our discretion.
Get in touch with a P3 team member