Hello P3 Adaptive Blog readers!
Well, it’s been a while since I’ve blogged – what can I say, it was a busy summer! BOO you say?! You need your Cat Meme fix!?! Well, let’s see if I can DO something about that!

Ha, ha! So, it turns out… there’s not a
whole lot of “Boo” Cat Memes.
In any case, I spent a LOT of the summer providing Foundations, Power Query, and Power BI training – every other week, in fact! And it seems that this NEW and IMPROVED way of using Excel is really catching on! It’s been a rewarding experience being able to provide Power BI training to traditional Excel users to empower and expedite their Power BI journey!
And just like that… we are now starting the fall season and the month of October! October is my favorite month! Even though in Phoenix, AZ, fall is simply just the change in the angle of the sun. Yeah, it’s still 100 degrees! But that is fine by me… I like it hot!
But I do miss that change in the season that brings those beautiful fall colors ![]()

MUCH easier finding a funny “Fall” Cat Meme!
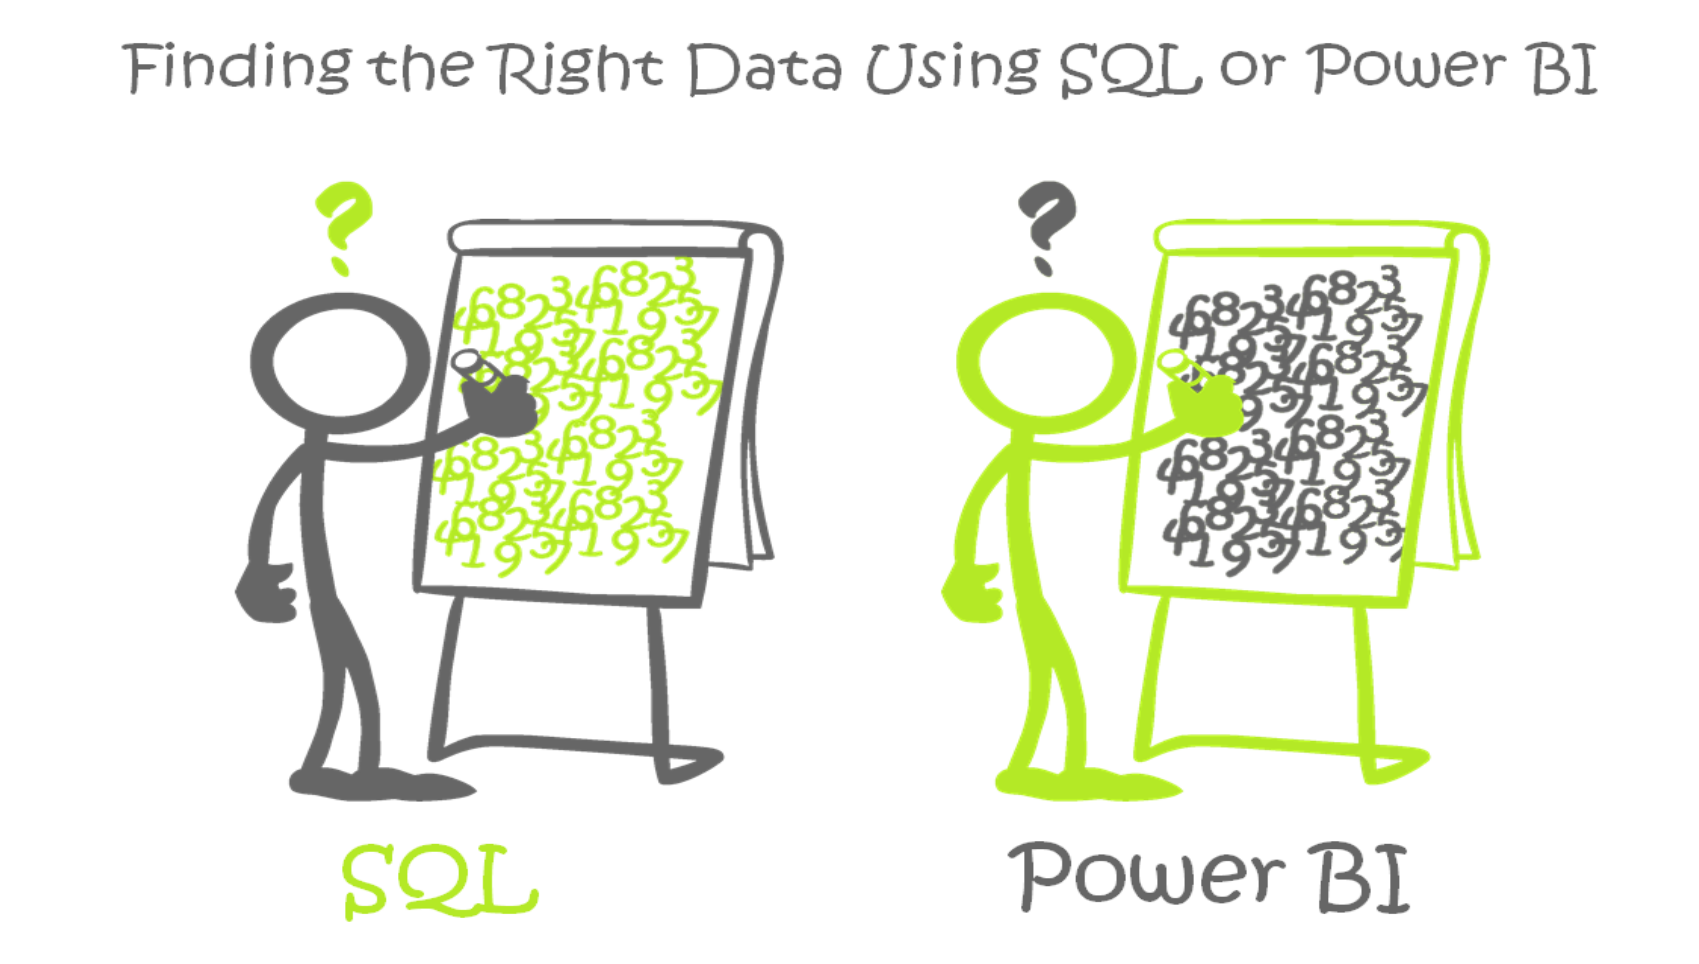
So today, I want to blog about something else I miss – or do I? And that something is SQL!
For a very long, long, long time… I thought that my SQL superpowers were far more superior to anyone else’s traditional Excel superpowers! But now, with the NEW and IMPROVED Excel… I’m not so sure!
But one thing that I do know is… whether you use SQL, the NEW and IMPROVED Power Pivot in Excel, Power BI or any other technology… all of it starts with the data!
And as most of you probably already know – working with data is not a simple job. Honestly, that is where I still spend at least 80% of my time with any Power Pivot in Excel or Power BI project!
So, all this Power BI AWESOMENESS starts with the data! And to get to that amazing AWESOMENESS, we’ve got to do some things…
- First, we sometimes need to just get ACCESS to the data!
- Then we’ve got to FIND the data that we need!
- Once we’ve found data, then we need to PREPARE the data.
- And finally, we can load and use the data… to be DATA SUPERSTARS!
Okay, so now onto the helpful TRICKS part of the post! I’m going to share a couple of techniques in SQL and in Power BI that I often will use to help me find the right data.
Trick 1: Finding the RIGHT tables.
Using SQL Super Powers >
If my data sources are on SQL, I can use the following SQL query to find all tables in the database that have the column(s) that appear to be what I’m looking for.
NOTE: For any SQL newbies, SQL has system tables that store information about all objects on a SQL Server/Database. These system tables can be queried!
SQL Query >
select
[TABLE_CATALOG],
[TABLE_SCHEMA],
[TABLE_NAME],
[COLUMN_NAME],
[DATA_TYPE]
from [information_schema].[columns]
where ([COLUMN_NAME] like ‘%score%’)
SQL Query Results >

The above example illustrates a use case where I’m trying to identify if there is a table on the database with a column that stores a “score” value. I’m guessing that the column will have some form of the word “score” in the name. The SQL query tells me that two possible tables might have the “score” column that I’m looking for – either the [Accounts] or [Contacts] table.
And what if you don’t have SQL Server Management Studio?
Another option would be to use Power Query!
Using Power BI Super Powers >
• In either Excel or Power BI Desktop, select the Get Data option and choose to connect to a SQL Server data source.

NOTE: Anyone notice Excel is looking a bit different – is this a Trick or a Treat? It’s the latest O365 subscription update! For the remainder of this post, I will be illustrating the solution using Power BI Desktop. However, you can also do this in Excel.
• Next enter the Server Name, Database Name and choose the Advanced options to enter the same SQL query.

• Then when you select Edit to show the results in Power Query, you’ll have the same result set – and you can further investigate which of these tables has the “score” column and values that you need!

Trick 2: Finding the RIGHT columns.
Now that I’ve found the possible tables and columns, I still need to check to see WHICH column has the correct values that I need!
For my example use case, I only have two possible tables. But most times, I have many tables and many columns! And the process of finding the data that I’m looking for can be very time-consuming.
Using SQL Super Powers >
For example, what if I also know that the “score” value that I’m interested in has the values of “GOLD’, “SILVER” or “BRONZE.”
If I had a table like the following, I could write a query and find the correct table and column name.

For example, if I’m trying to locate the table and column that has the values of “GOLD’, “SILVER,” or “BRONZE” then I can quickly find the exact table and column that has the values I’m looking for by writing the query below!

From the query results, we can see that it is the [Accounts] table and the [account_score] column that contains the values of “GOLD’, “SILVER,” or “BRONZE” – so we know from which table we need to pull the data.
You can download a zip file containing the SQL Script and example .pbix files for tricks 1 and 2 here
Please reference the file called “Blog_20181001_SQL_Script.sql for the SQL query.
But again, what if I don’t have SQL and SQL Server Management Studio? Can I use Power Query to create a similar solution? Let’s see!
Using Power BI Super Powers >
- First, I create a new PBID file. Then, I chose Get Data and select the SQL Server data connector option. I provide the Server Name, Database Name, choose a table to get started and launch the Power Query editor.
- Next, I apply best practice logic and organization using Groups (aka Folders). The Source Group contains only the connection to the SQL Server and Database. Then, in the Staging Group, I reference the = #”Source – SQL” query.
- In the Data Model Group, you’ll find the Data query, which contains the logic needed to start with the list of tables on the Database (shown below).

- Finally, I can create logic in the Applied Steps to transform the list of tables on the Database source data into the final table results (see below)

From here, we can simply filter the results, or we can be fancy and create a visual output to display and filter the results. And we can give our report a fun Fall/October/Halloween design by importing the Halloween.json custom theme file!

And we can once again see that the [Accounts] table and the [account_score] column does contain a value of “GOLD,” which is one of the values that we are looking for in the data!

So, do I miss my SQL superpowers? Maybe… maybe not ![]()
Trick #1 was faster for me to execute in SQL. However, Trick #2 was faster in Power BI – and no code!
Happy Fall, Happy October and hopefully these couple of little TRICKS will help give you some ideas to make finding the right data that YOU need a bit HAPPIER too!
Happy Data Haunting… Muah Ha, ha!
Did you find this article easier to understand than the average “tech” article?
We like to think that is no accident. We’re different. First of a new breed – the kind who can speak tech, biz, and human all at the same time.
Want this kind of readily-absorbable, human-oriented Power BI instruction for your team? Hire us for a private training at your facility, OR attend one of our public workshops!
