I don’t like to answer these or similar questions:
“What is your career path?”
“Where do you see yourself in five years?”
“…in ten years…?”
I generally find it hard to answer questions about what I do, because my answer is always vague – “Ummm…data stuff!” Either people don’t want to hear the details or they don’t understand when I try to explain. I also find it uncomfortable when someone describes me as a ‘data guru’ as I’m always painfully aware of how little I know of an immense and ever-growing subject.
The truth is, I have no career path. I have no plan for five, ten or any other number of years. I have never had any of these things. By nature, I’m a stress-head, but for some reason, I’ve always been kind of happy-go-lucky about this.
Is that a bad thing? I don’t think so, it’s turned out well so far!
At university, I studied a combined subject’s degree in mathematics and information technology. I didn’t do that for a reason, they were just the subjects I’m good at. I started out studying math and psychology, with IT as a minor subject to be dropped after a year, but at the end of the first year, it was obvious that I was far stronger in IT than psychology. None of this seemed to lead to anything practical, or concrete, but I didn’t give it much thought. This was so long ago that the IT course was mostly assessed by written exam – on paper! Hard to imagine now.
After university, I fell back into a temp job that I’d returned to each summer at a local college. I was doing everything from data entry to reception, switchboard and call center work. All to start paying off some of the mountainous student debts. Eventually, an IT helpdesk job came up, which I got, but only lasted in for three weeks before being poached by the Management Information Systems team. Supporting an Oracle-based system I learned SQL, and by delivering reporting to the organization I honed my Access and Excel skills. Eventually, I was promoted to team manager.
This was the start of my data life – I suppose I appreciate the logic of the data world, I like the sense of order and process. And I love problem-solving! The same skills apply to my hobbies – embroidery, knitting, crochet, and sewing. On the surface, these might seem creative, but really they are all about logic, process, strong documentation and problem-solving. There’s room for creativity too and sometimes I challenge myself, but as I’m not a designer it isn’t as essential as you’d expect. The most intricate knitting patterns, for example, are often charted, which I find logical and easy to follow.
They often look a little like this:
After six years or so at the college, a chance came up to work for the government agency to whom the college submitted their statutory data returns. The phrase I heard a lot was “poacher turned gamekeeper.” This was still all about data, but initially facing outwards, supporting learning providers (such as colleges) to return complete, accurate and timely statutory data returns. The role evolved until eventually, the customer base was more internal. The work was mainly the analysis of massive datasets and I was working with SQL Server, Analysis Services and SPSS as well as the universal constant – Excel.
Nine years of evolving roles ended with voluntary redundancy, a huge leap of faith in my abilities which ended, happily, in a new job offer long before I’d finished my notice. This time I moved into the private sector, which was a very different experience. This was back to systems support, with Integration Services, Analysis Services and a finance qualification added to my repertoire. In another four years, just about a year ago, I moved again, this time into the housing sector. My employer is GreenSquare Group, a major provider of housing, regeneration, care, support, and commercial services across Wiltshire, Oxfordshire, and Gloucestershire. As a registered social landlord, GreenSquare owns and manages nearly 12,000 properties, as well as building around 250 new homes for sale and shared ownership each year through its in-house development company GreenSquare Homes.
For the first time since that very first helpdesk role, I’m working fully within an IT team again. The culture here is forward-thinking and enthusiastic and I’m loving it. The employee base is diverse, including back office staff as well as a wide range of skilled trade operatives, housing staff, and customer service representatives. Our IT team is welcoming and lively and has fun despite working in a fast-paced, busy environment. There is a lot to do, with areas in which I can make a big difference and that, to me, is engaging.
We’re now several months into a major project which will change the way the organization uses data. Instead of the traditional ‘do stuff – analyze data – look at what we did’ model, we want a more proactive ‘look at what we did – where can we improve – do stuff better’ approach. As an example, by being able to see where we have a high volume of repairs in a particular neighborhood we can proactively plan for redevelopment or reinvestment. This relies heavily on having the right data available, when needed, in easy to access formats.
So far, we have found several big challenges, including:
- Introducing new technology – but everyone is excited about the possibilities. We’ve put together a sample report for demonstrating what is possible, and the internal customers we have spoken to so far are all looking forward to the new world and how it will improve their working lives;
- Data quality – which is a big challenge, as our main system contains data from several separate systems combined into one, after organization mergers. We’re approaching this as an opportunity to cleanse some of the older data, particularly in light of the new GDPR requirements. This is also a chance to review any processes which have not been under the spotlight recently;
- Persuading our customers – the Enlighten Aquarium is the best visual for their purposes, not just ‘a bit out there and revolutionary,’ we can use it in real live reports. I’ve got one or two converts, and when everyone else sees it in use, they’ll all want one!
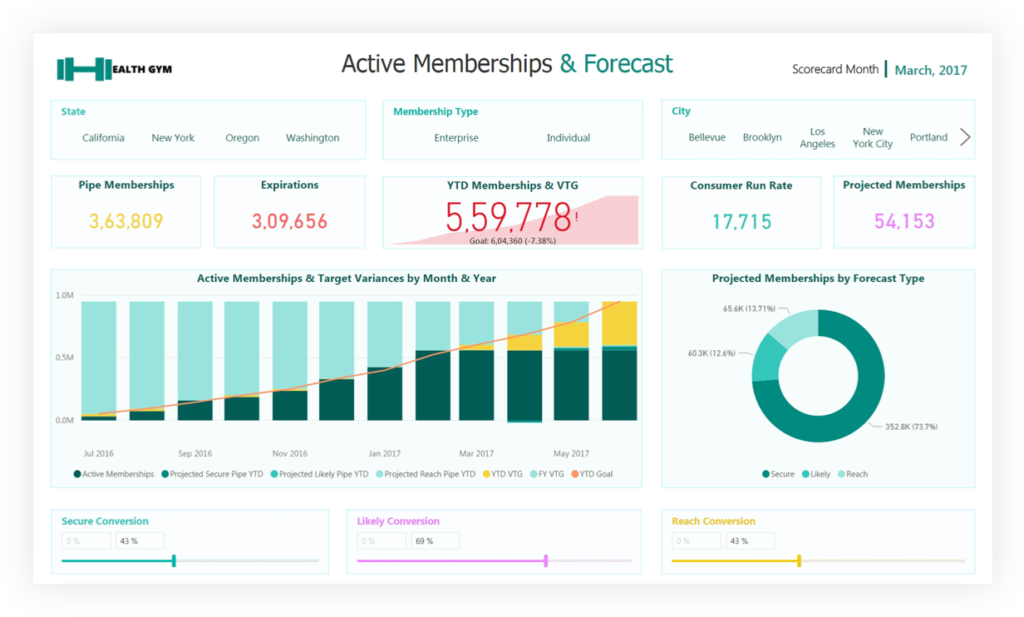
Within my first week, I was given access to Power BI and a data source and asked to investigate, learn and demonstrate what was possible – a challenge? Yes, but only a good one! Alongside learning how to use the tool, I built a sample report for demonstrating just a few of the options. Power BI is my new favorite tool. The possibilities look endless and with the constant updates and new features (not to mention the ever-expanding marketplace visualizations), I don’t think I’ll be getting bored of this quickly. There is so much to learn and I love that.
From time to time I have to focus on other aspects of the role, for example, requirements gathering or building and maintaining a data warehouse, and find myself using Power BI for not-quite-work-related tasks in my own time. For example, our team had a football World Cup sweepstake going…so I built a report to pull results from a website and analyze them. To make it more fun, we didn’t just pay out to the overall winner, there were various more complicated prizes too. Below is an embedded version of the .pbix you can interact with,
You can download a copy of the World Cup .pbix here
So, you ask, what’s next? Nope, I still can’t answer that question! For now, I’m happy here. Then I’ll fall back on a philosophy that has always worked so far – something will turn up!
Forget bending spoons with your mind – there’s no money in it.
It takes a special kind of mindset to “bend” data (and software!) to the human will. As this article demonstrates, we at P3 Adaptive can twist Power BI into a pretzel if that’s what an organization needs. (A robust, trustworthy, industrial-strength pretzel of course).
The data-oriented challenges facing your business require BOTH a nimble toolset like Power BI AND a nimble mindset to go with it. And as Val Kilmer / Doc Holladay once said, we’re your huckleberry.