Guest Post by Andrew Todd

image48-1024x526
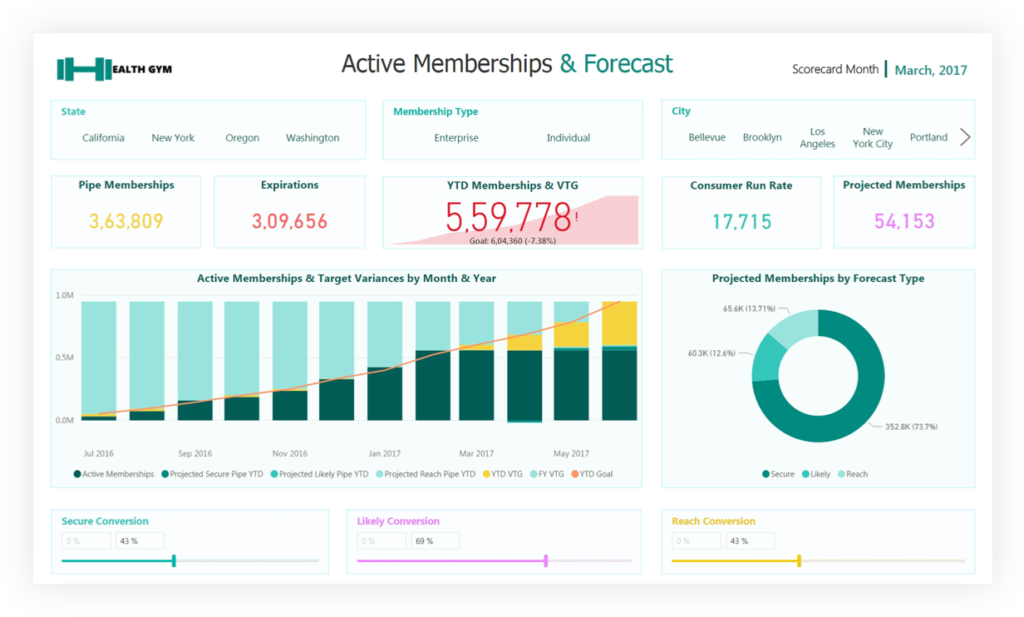
Build awesome dashboards for mobile and desktop using Datazen

Datazen is a great visualization tool that is free to Microsoft SQL Server Enterprise customers. If you haven’t worked with Datazen yet, check out this post by Rob and Chris! Datazen allows you to design an awesome dashboard before you even work with any data! You simply draw a visualization, and then Datazen reverse engineers the exact layout of the aggregate table that you need in order to make that visualization work.

If you already have a PowerPivot model that you use for reporting, naturally you’ll want to use it to build visualizations in Datazen rather than reinvent the wheel entirely. One way to incorporate your dozens or even hundreds of measures and model logic (not to mention dozens of hours) into Datazen visualizations is through DAX queries.

Two Paths to Datazen DAX Query Nirvana…

Ok, you’ve built a fantastic BI dashboard in Datazen and your chakras are perfectly aligned. Now, there are two enlightening paths that you could take to build tables for Datazen visualizations with DAX queries:

A) Create a new ‘Data Connection’ in Datazen to your PowerPivot model hosted on SharePoint/SSAS Tabular, using the Analysis Services Data Provider. You can automate the refresh of data with SharePoint/Power Update and in Datazen itself.

B) Query your Power Pivot model using DAX Studio and save the workbook to a One Drive folder, then import the data into Datazen. This process can also be automated using Power Update.

Let’s take a closer look at both of these methods, starting with a SharePoint hosted Power Pivot model.

A) Building DAX Query Tables from an existing SharePoint Core Model

Many Power Pivot Pros will be familiar with the terms ‘core’ and ‘thin’. The core workbook contains the Power Pivot model and is hosted on SharePoint, and the ‘thin’ is a separate workbook that contains the connection to that model. The thin is where the pretty charts, cubes and pivots reside, and the core is where the model resides. In Datazen, you can query a core model hosted on SharePoint or SSAS Tabular through an Analysis Services connection like you can in Excel.

First, you’ll want to log in to the Datazen control panel, and navigate to the BI Hub that you want your dashboard to live in. From here, click on ‘Data Sources’ and choose ‘New Data Connection’.

image

Just like creating a thin workbook in Excel, you’ll want to choose the ‘Microsoft SQL Server Analysis Services’ data provider.

Enter a ‘Data Connection Name’ of your choice.

In the ‘Data Source’ property, enter the full URL to the workbook that you have hosted on SharePoint or the name of your SSAS Tabular Server.

image

Congratulations, you have created a connection to your workbook! Now on to building the query!

Datazen let’s you build what are called ‘Data Views’, which are views that can be stored in the shape needed for various Datazen visualizations and used on demand when building dashboards.

Lucky for us, a DAX query table can be stored as a ‘Data View’! Simply click on ‘New Data View’ and enter the name of the ‘Data View’ that you desire.

image

Enter the DAX query in the ‘Data View Query’ section (example DAX Queries are at the end of this post).

Datazen allows you to refresh your data view on various time schedules, and even allows for super fancy live connections (which we’ll save for another post). Smile

B) Building DAX Query Tables in a Core Workbook and Exporting them to One Drive

image_thumb50

In the recent past, there were various hacks that had to be used to build DAX query tables within a composite workbook. However, now we have DAX Studio – the super cool route to a linked DAX Query table. DAX Studio allows you to execute a DAX Query against the Power Pivot model. Once written, you can select an option to create a linked DAX Query table within the workbook.

DAX Studio can be downloaded for free here.

image

Once installed, you’ll see a DAX Studio icon in your Excel ribbon. Once you click the DAX Studio icon, you’ll be prompted to select a data source. Choose the local Power Pivot model.

Click on the drop down under ‘Output’ and choose ‘Linked’.

Enter your DAX Query in the Query Window and press the ‘run’ button. The query should run and build a table that is linked to your Power Pivot model within the workbook.

image

Once you have created the linked DAX Query table in your core workbook, you could simply save that workbook to your One Drive folder, sync it to a linked OneDrive folder on your Datazen server and then import it as a Data View in Datazen.

If you have several large core workbooks, you would probably rather have a ‘thin query workbook’ that contains just the DAX query tables. A little VBA can automate the export of these tables to a ‘thin query’ workbook, that can then be imported into Datazen for use in a dashboard.

Here’s a simple VBA macro that you can use to save just the DAX Query Table to a ‘thin’ workbook:

Sub CopyTable()
    Range("DAXQueryTableName[#All]").Select
    Selection.Copy
    Workbooks.Add
    ActiveSheet.Paste
ActiveWorkbook.SaveAs Filename:="C:\OneDrive\ThinQueryWorkbook.xlsx"
End Subpower-update

To automate this query and export process, we add yet another great tool to the mix – Power Update!

Schedule a refresh on your core model workbook and under ‘Advanced Settings’, select ‘Run Macros After Update’. Enter the macro that you are using to export your query tables to OneDrive. Voila!

Building Your Datazen Tables in DAX

Now we get to the FUN part!

When building measures, we know that there are certain ‘helper’ DAX functions that supply needed filter context to another DAX function, but cannot be used on their own. FILTER() is a great example of a ‘helper’ function. For example, if you wanted to calculate the sum of the product of ‘Table1’[Column A] and ‘Table1’[Column B] where ‘Table1’[Column C] = “Green”, we could use the following measure: SUMX(FILTER(‘Table1’, ‘Table1’[Column C]=”Green”),’Table1’[Column A]*’Table1’[Column B]).

In DAX queries, FILTER() can be used to return an entire table with the filter context you supply! Using the example above, we could write the following DAX query to return all of ‘Table1’ where ‘Table1’[Column C] = “Green”

EVALUATE
FILTER(
  ‘TABLE1’
  ,’TABLE1’[Column C] = “GREEN”
)

Note: EVALUATE always precedes the portion of a DAX query with the query instructions.

Cooking the Perfect Funnel Pie

Throw either a funnel chart or pie chart into Datazen and you’ll get the following table.

image

Here’s a DAX query that will produce a table that Datazen can use for either a funnel chart or a pie chart:

EVALUATE
ROW (
  “Metric1”, [Metric1],
  “Metric2”, [Metric2],
  “Metric3”, [Metric3],
  “Metric4”, [Metric4],
  “Metric5”, [Metric5]
)

In the above query (like in all DAX queries), EVALUATE precedes the query. EVALUATE just marks the beginning of the query command.

We use the ROW() function to pull in each metric needed for our Datazen table. Each additional column added to the ROW() function is preceded by a column name, followed by the measure that we want to add. The result is a table in the format needed by Datazen to build a pie chart or funnel chart!

The above query would work also if you wanted to modify the measure’s filter context using calculate, as in the first ROW() function below:

EVALUATE
ROW (
    “Metric1”,
      CALCULATE ( [Merric1], CalendarDate[YearNumber] = 2015 ),
    “Metric2”, [Metric2],
    “Metric3”, [Metric3],
    “Metric4”, [Metric4],
    “Metric5”, [Metric5]
)


Bar Chart Hopping

What dashboard would be complete with a bar chart?

Datazen builds the following table structure for you for building the perfect bar!

image

Now enjoy a free round of DAX on the house!

EVALUATE
SUMMARIZE (
    CALENDARTABLE,
    CALENDARTABLE[FirstDateofMonth],
    “Metric1”, [Metric1],
    “Metric2”, [Metric2],
    “Metric3”, [Metric3],
    “Metric4”, [Metric4],
    “Metric5”, [Metric5]
)

SUMMARIZE() can be used to group columns and measures to create an aggregate table, sort of like GROUP BY in SQL. For our purposes, we use SUMMARIZE() to pull a table of all of the FirstDateofMonth column in the CalendarDate table. We then group each metric we want to display on the chart evaluated in the context of that date.

One Power Pivot Data Model – Multiple Visualizations

As you have heard us speak on occasion – Power Pivot Data Model is the Center of Power BI Universe. That is the beauty of creating a Power Pivot Data Model. You can build multiple visualizations using myriads of tools. Datazen is a key addition to that set. It’s an amazing tool with a unique approach (you draw the visualization before you work with any data) and offers mobile and desktop viewing for all users. We hope that it would become easier to connect Datazen to PowerPivot Data Model. However for now, as you have seen, by writing some simple DAX Queries you can get started on building Datazen dashboards leveraging your existing PowerPivot Data Model.